What is the mean difference between the samples?

Glencoe Algebra 1, Student Edition, 9780079039897, 0079039898, 2018
18th Edition
ISBN:9780079039897
Author:Carter
Publisher:Carter
Chapter10: Statistics
Section10.4: Distributions Of Data
Problem 19PFA

Related questions
Question
Transcribed Image Text:Group Statistics
Std.
Std. Error
Neighbourhood N
Trips A
Mean
Deviation
Mean
7 22.29
16.760
6.335
43.29
19.474
7.360
Independent Samples Test
LAYene'A Test
for Equality of
Varlances
t-test for Equality of Means
Sig.
(2-
ef tailed) Difference Difference
Mean
Std. Error
Trips Equal variances .349
Sig.
.556 -2.16
12
.051
-21.000
9.711
assumed
Equal variances
-2.16 11.7
.052
-21.000
9.711
not assumed
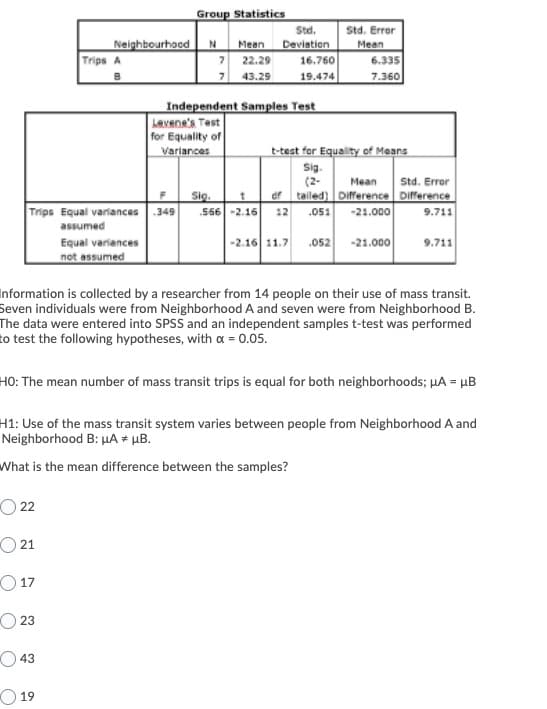
Information is collected by a researcher from 14 people on their use of mass transit.
Seven individuals were from Neighborhood A and seven were from Neighborhood B.
The data were entered into SPSS and an independent samples t-test was performed
to test the following hypotheses, with a = 0.05.
HO: The mean number of mass transit trips is equal for both neighborhoods; µA = µB
H1: Use of the mass transit system varies between people from Neighborhood A and
Neighborhood B: HA * µB.
What is the mean difference between the samples?
O 22
O 21
O 17
O 23
O43
19
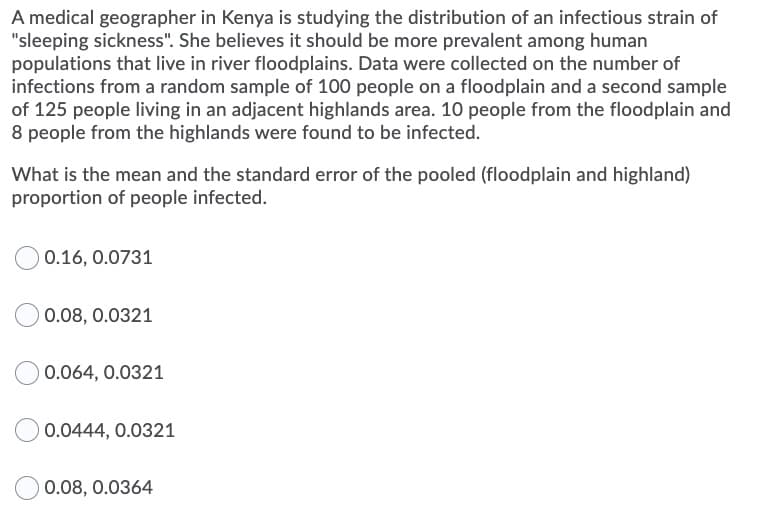
Transcribed Image Text:A medical geographer in Kenya is studying the distribution of an infectious strain of
"sleeping sickness". She believes it should be more prevalent among human
populations that live in river floodplains. Data were collected on the number of
infections from a random sample of 100 people on a floodplain and a second sample
of 125 people living in an adjacent highlands area. 10 people from the floodplain and
8 people from the highlands were found to be infected.
What is the mean and the standard error of the pooled (floodplain and highland)
proportion of people infected.
0.16, 0.0731
0.08, 0.0321
0.064, 0.0321
0.0444, 0.0321
0.08, 0.0364
Expert Solution
This question has been solved!
Explore an expertly crafted, step-by-step solution for a thorough understanding of key concepts.

Step by step
Solved in 2 steps

Recommended textbooks for you
Glencoe Algebra 1, Student Edition, 9780079039897…
Algebra
ISBN:
9780079039897
Author:
Carter
Publisher:
McGraw Hill
Glencoe Algebra 1, Student Edition, 9780079039897…
Algebra
ISBN:
9780079039897
Author:
Carter
Publisher:
McGraw Hill