What is the computed value of the pillai's V. Final answer tk r places.
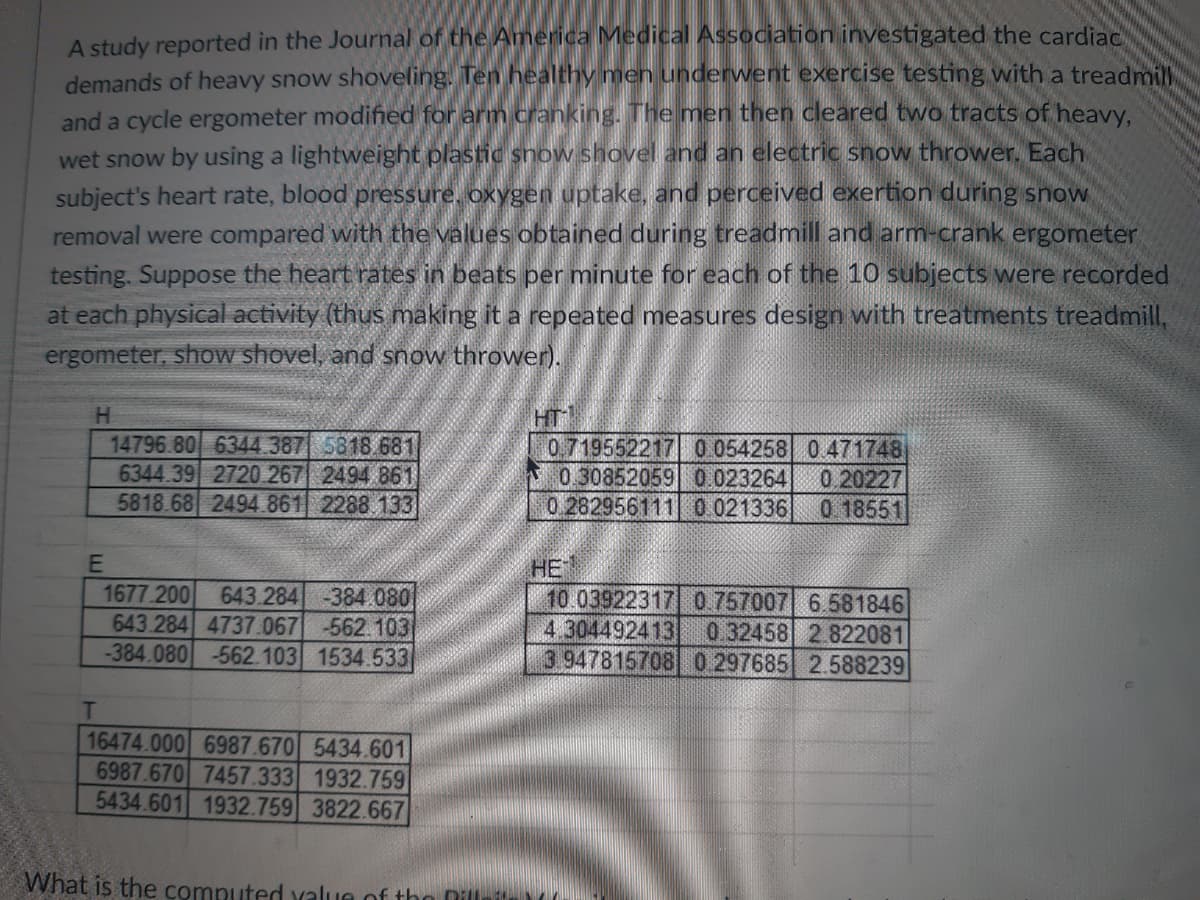
Q: You are testing the claim that the proportion of men who own cats is larger than the proportion of…
A: Given,n1=190 , p^1=0.20n2=90 , p^2=0.45
Q: Tardigrades, or water bears, are a type of micro-animal famous for their resilience. In examining…
A: Given that Sample size n =28 Sample mean=836 Standard deviation =60
Q: You measure 24 textbooks' weights, and find they have a mean weight of 35 ounces. Assume the…
A: given data, n=24df=n-1=24-1=23X¯=35σ=9CI=0.95α=1-0.95=0.05
Q: Find the critical value for a two-tailed test with α=0.07 and n=36.
A: Given that Level of significance α=0.07 and sample size n=36
Q: The following data represent the muzzle velocity (in feet per second) of rounds fired from a 155-mm…
A: As per the Bartleby guildlines we have to solve first three subparts and rest can be reposted...…
Q: Twelve subjects with diagnosed hypertension were randomly selected for this study. The age at which…
A:
Q: increase or decrease in the amount of food consumption. To test this hypothesis, they monitored food…
A: Given Patients in the treatment group ate 52.1 grams of biscuits, with a standard deviation of 45.1…
Q: For a one-sample t-test, if other factors are held constant, which set of sample characteristics is…
A: Given that μ = 100
Q: This problem demonstrates a possible (though rare) situation that can occur with group comparisons.…
A: From given data we have : A B C 55.4 31.2 60.9 57.4 44.4 62.3 68 55.4 68.3 49.3 52.6 61.7…
Q: An automotive engineer wants to estimate the cost of repairing a car that experiences a 25 MPH…
A: We have given that Sample size (n) = 24Sample mean (M) = 11000Standard deviations (s) =…
Q: Claim: Most adults would erase all of their personal information online if they could. A software…
A: Given n=408 P=0.5 P-cap=0.59
Q: A simple random sample from a population with a normal distribution of 104 body temperatures has x =…
A:
Q: Here is data with y as the response variable. X y 68.4 10.2 74.7 -9.4 75.5 112.4 81.9 -12.2 32.6…
A: Form given data we have :
Q: (a) Determine the total area under the standard normal curve to the left of z= -2 or to the right of…
A:
Q: The following data are from an independent-measures experiment comparing two treatment conditions:…
A: Given that The following data are from an independent-measures experiment comparing two treatment…
Q: Use the Dental Clinic data set below, a = 0.4, and ß = 0.2 to calculate the adjusted exponential…
A: Given information: α=0.40, β=0.20 Day Number of Patients Tuesday 35 Wednesday 38 Thursday…
Q: Your company just became international by offering its products in both the United States and…
A:
Q: ompanying data represent the monthly rate of return of a certain company's common stock for the pas…
A: Formula IQR=Q₃-Q₁
Q: I don't understand what is the answer
A: 90% Confidence interval for proportion is (0.487 , 0.502)
Q: The data below are the final exam scores of 10 randomly selected statistics students and the number…
A:
Q: A recent study found that 18 out of 30 students believe that 8 AMs are tougher than other class…
A: We have given that p = 43% = 0.43% n = 30x = 18p̂ = x/n = 18/30 = 0.6
Q: The salaries of a random sample of 12 teachers from state A and 12 teachers from state B are shown…
A: The degrees of freedom is n1+ n2-2 n1= n2= 12 df= 12+12-2 = 22
Q: 3 What, if any, conclusions can you form by using your calculations about the filling processes of…
A: With reference to calculations done in previous partsThe percentage of all samples of Oxford's O's…
Q: A supermarket wants to test the effect of the height of the shelf display on the monthly sales of…
A: The test is to check the effect of the height on the shelf display on the monthly sales of its dairy…
Q: The table below gives beverage preferences for random samples of teens and adults. Teens…
A: Solution-: Hypothesis: H0: Two attribute type of age (i.e., adult and teen) (A) and drink…
Q: Tabulation of a strike vote showed that 90% of those voting cast their ballot in favour of strike…
A: It is given that p = 90% = 0.90 n = 50
Q: The table lists chest sizes (distance around chest in inches) and weights (pounds) of bears. Chest…
A:
Q: 3E1. The head librarian at the Library of Congress has asked her assistant for an interval estimate…
A: According to the Bartleby guidelines expert solve only one question and rest can be reposted.
Q: The classrooms in the Psychology department are numbered from 100 to 108. A professor records the…
A: Frequency Polygon is a suitable diagrammatic mode of exhibiting the frequency distribution of a…
Q: Exam 1 75.2 71.3 62.4 73.3 63.8 75.8 81.9 61.4 63.9 94.4 75.6 90.1 85.1 87.0 60.2 71.2 45.6 56.0…
A: Probability of an event is the ratio of the number of cases favorable to the event to the total…
Q: 8. his 3-cr sociology class. What is his GPA for the Ken earned a A-in his 5-cr English class, a B…
A: GPA for grades: A = 4 B= 3 B+=3.3 C=2The above information in a table form: Subject Credit (wi)…
Q: Ho:μ1=μ2Ho:μ1=μ2 Ha:μ1≠μ2Ha:μ1≠μ2 You believe both populations are normally distributed, but…
A:
Q: Two samples are taken with the following numbers of successes and sample sizes r1 = 38 r2 = 25 n1 =…
A: Given: Two samples are taken with the following numbers of successes and sample sizes: r1= 38r2= 25…
Q: In general, if the variance of the difference scores decreases, what will happen to the value of the…
A: Solution-: In general, if the variance of the difference scores decreases, what will happen to the…
Q: 3. Given fxx(x,y)= 4x² On Support 0 Otherwise Let U=Y-X. Determine f(u) (Including the Support of U)…
A:
Q: PROB AND STATS DO NOW 1 DEPENDENT AND INDEPENDENT EVENTS MR.SAM Determine whether the events are…
A: 1)Independent Explanation : Here we are throwing the cubic dice two times. Each throw is…
Q: walk is normally distributed with mean 12 months and standard deviation 2.5 month. 35 randomly…
A: Given that. μ=12 , ?=2.5 , n=35 Z-score =( x - μ )/? NOTE:- According to bartleby…
Q: Based on the data shown below, calculate the regression line (each value to two decimal places) y =…
A: From the provided information, The table is as follow: x y 2 7.52 3 8.03 4 11.04 5 15.55…
Q: survey of college students asked them about the mode of transportation they used to travel to…
A: Given that 240 students drove a car to school, 30 students rode a bike, 50 students took the bus,…
Q: The table below shows the number of state-registered automatic weapons and the murder rate for…
A: The linear equation is: y^=0.89x+3.8
Q: answer to be 0.98347 this is how I approached the problem. P(A)=0.95, P(B)=0.96,P(C)= 090, P(D)=…
A: the probabilities that A, B, C, D, and E fail is 0.05, 0.04,0.10, 0.04, and 0.06. so, the…
Q: A new type of corn seed has been developed and a team of agronomists wanted to determine whether…
A: Multiple regression model consist of one dependent variable and more than one independent variable.
Q: at plan to hire additional employees in the next 60 days. ow many randomly selected employers must…
A: Given Margin of error (E) =0.06 95% confidence for 1.96
Q: Assume that adults were randomly selected for a poll. They were asked if they "favor or oppose using…
A:
Q: A hospital wants to determine if the type of treatment for pneumonia is a factor in recovery time?…
A: From given
Q: Let X be a 3 x 1 random vector eigenvalues and eigenvectors are given below. This is Σ 5 -2 0 -2 6 2…
A: Given information: The var-covariance matrix is given Σ=5-20-262027 Find: Correct statement.
Q: Use the data values in the table below to calculate the correlation between the variables x and y.…
A: From the provided information, The data values are as follow: x y 4 15.52 5 17.4 6 17.68…
Q: Construction costs in East LA is not cheap. You want to build a simple cost estimator for…
A: It is given that variable x is the floor space and y is the construction cost.
Q: he data below are from an independent-measures experiment comparing three different treatment…
A: Given: Number of groups (k)=3 Number of sample (n)=18 Treatment 1 Treatment 2 Treatment 3 0…
Q: You want to obtain a sample to estimate a population proportion. At this point in time, you have no…
A: Given Level of significance ɑ=0.10, margin of error=e=0.04
Step by step
Solved in 3 steps with 5 images
- An automotive engineer is investigating two different types of metering devices for an electronic fuel injection system to determine whether they differ in their fuel mileage performance. The system is installed on 10 different cars, and a test is run with each metering device on each car. The data is provided below: Metering Device Car 1 2 1 17.6 16.8 2 19.4 20.0 3 18.2 17.6 4 17.1 16.4 5 15.3 16.0 6 15.9 15.9 7 16.3 16.5 8 18.0 18.4 9 17.3 16.4 10 19.1 20.1 Is there a significant difference between the means of the two metering devices? Use . Interpret the result in the context of the problem. An article in the journal Hazardous Waste and Hazardous Materials (Vol. 6, 1989) reported the results of an analysis of the weight of calcium in standard cement and cement doped with lead. Reduced levels of calcium would indicate that the hydration mechanism in the cement is blocked…Since its removal from the banned substances list in 2004 by the World Anti-Doping Agency,caffeine has been used by athletes with the expectancy that it enhances their workout andperformance. However, few studies look at the role caffeine plays in sedentary females.Researchers at the University of Western Australia conducted a test in which they determined therate of energy expenditure (kilojoules) on 10 healthy, sedentary females who were nonregularcaffeine users. Each female was randomly assigned either a placebo or caffeine pill (6mg/kg) 60minutes prior to exercise. The subject rode an exercise bike for 15 minutes at 65% of theirmaximum heart rate, and the energy expenditure was measured. The process was repeated on aseparate day for the remaining treatment. The mean difference in energy expenditure (caffeine –placebo) was 18kJ with a standard deviation of 19kJ. If we assume that the differences follow anormal distribution can it be concluded that that caffeine appears to increase…Suppose a researcher is interested inthe effectiveness in a new childhood exercise program implemented in a SRS of schools across a particular county. In order to test the hypothesis that the new program decreases BMI (Kg/m2), the researcher takes a SRS of children from schools where the program is employed and a SRS from schools that do not employ the program and compares the results. Assume the following table represents the SRSs of students and their BMIs. Student intervention group BMI (kg/m2) Student control group BMI (kg/m2) A 18.6 A 21.6 B 18.2 B 18.9 C 19.5 C 19.4 D 18.9 D 22.6 E 24.1 F 23.6 A) Assuming that all the necessary conditions are met (normality, independence, etc.) carry out the appropriate statistical test to determine if the new exercise program is effective. Use an alpha level of 0.05. Do not assume equal variances.B) Construct a 95% confidence interval about your estimate for the average difference in BMI between the groups.
- A low-level CDC bureaucrat wants to please his boss by gathering evidence thatthe current government-mandated shutdown of society is not causing people’s mentalhealth to deteriorate, so that it can safely be continued for several years if anyexpert says it’s necessary.He polls a random sample of 1600 citizens, gathering data on such items asincome loss, weight gain, access to toilet paper, hours spent binge-watchingNetflix, and number of injuries caused by household fights, and compiles all thisinto a scientifically-weighted “misery index”.The mean misery index from the sample is 99.2; it seems reasonable to use apopulation standard deviation σ = 19.1.a) Does this information provide significant evidence (at the 5% level) that thenationwide mean misery index is less than 100? Set up appropriate null andalternative hypotheses, calculate the appropriate test statistic, find the P-value,and state your conclusion. (10)b) A CDC press release publishing the results of this study claims that…A low-level CDC bureaucrat wants to please his boss by gathering evidence thatthe current government-mandated shutdown of society is not causing people’s mentalhealth to deteriorate, so that it can safely be continued for several years if anyexpert says it’s necessary.He polls a random sample of 1600 citizens, gathering data on such items asincome loss, weight gain, access to toilet paper, hours spent binge-watchingNetflix, and number of injuries caused by household fights, and compiles all thisinto a scientifically-weighted “misery index”.The mean misery index from the sample is 99.2; it seems reasonable to use apopulation standard deviation σ = 19.1.a) Does this information provide significant evidence (at the 5% level) that thenationwide mean misery index is less than 100? Set up appropriate null andalternative hypotheses, calculate the appropriate test statistic, find the P-value,and state your conclusion. b) A CDC press release publishing the results of this study claims that…The Diabetes Control and Complications trial research group, randomly assigned volunteers with type 1 (insulin-dependent) diabetes mellitus, but without retinopathy, either to a conventional treatment or to a more intensive treatment aimed at maintaining normal blood glucose levels. The volunteers' health was monitored closely for approximately six years. By the end of the study, 91 patients out of 378 in the conventional treatment group had developed retinopathy, whereas 23 out of 348 in the intensive treatment group had developed retinopathy. Test whether the rates of retinopathy differed significantly between the two treatment groups, if they did, which rate was significantly lower. 1. Provide the null hypothesis 2. Provide the alternative hypotheses 3. calculate the appropriate test statistic. Show all work 4. Identify the p-value for that test statistic 5. Using the p-value method and an alpha level of 0.02 state what your conclusions are regarding the null hypothesis, and…
- The Diabetes Control and Complications trial research group, randomly assigned volunteers with type 1 (insulin-dependent) diabetes mellitus, but without retinopathy, either to a conventional treatment or to a more intensive treatment aimed at maintaining normal blood glucose levels. The volunteers' health was monitored closely for approximately six years. By the end of the study, 91 patients out of 378 in the conventional treatment group had developed retinopathy, whereas 23 out of 348 in the intensive treatment group had developed retinopathy. Test wether the rates of retionpathy differed significantly betweenthe two treatment groups, if they did, which rate was significantly lower. 1. Provide the null hypothesis 2. Provide the alternative hypotheses 3. calculate the appropriate test statistic. Show all work 4. Indentify the p-value for that test statistic 5. Using the p-vlaue method and an alpha level of 0.02 state what your conclusions is regarding the null hypothesis, and…The director of an obesity clinic in a large northwestern city believes that drinking soft drinks contribute to obesity in children. To determine whether a relationship exists between these two variables, she conducts the following pilot study. Eight- 12-year-old male volunteers are randomly selected from children attending a local junior high school. Parents of the children are asked to monitor the number of soft drinks consumed by their child over a one week period. The children are weighed at the end of the week and their weights converted into body mass index (BMI) values. The BMI is a common index used to measure obesity and takes into account both height and weight. An individual is considered obese if they have a BMI value 30. The following data or collected: child. # of soft drinks consumed BMI 1 3 20 2 1 18 3…Does posting calorie content for menu items affectpeople’s choices in fast-food restaurants? According to results obtained by Elbel, Gyamfi, and Kersh(2011), the answer is no. The researchers monitoredthe calorie content of food purchases for children andadolescents in four large fast-food chains before andafter mandatory labeling began in New York City. Although most of the adolescents reported noticing thecalorie labels, apparently the labels had no effect ontheir choices. Data similar to the results obtained showan average of M = 786 calories per meal with s =85 for n =100 children and adolescents before thelabeling, compared to an average of M = 772 calorieswith s = 91 for a similar sample of n = 100 after themandatory posting.a. Use a two-tailed test with a = .05 to determinewhether the mean number of calories after theposting is significantly different than before caloriecontent was posted.b. Calculate r2to measure effect size for the mean difference.
- Knight and Haslam (2010) found that office workers who had some input into the design of their office space were more productive and had higher well-being compared to workers for whom the office design was completely controlled by an office manager. For this study, identify the independent variable and the dependent variableSuppose that, as part of a research methods class, Bailey was asked to write a summary of a research paper on the topic of the effects of oil contamination in soil on seed germination rates. Identify the explanatory and the response variables.University students are increasingly taking class notes on a laptop rather than writing their notes by hand. Students argue that laptops are more efficient, but professors typically disagree. Which method is better for developing conceptual understanding? In an experiment, 109 university students all watched the same lecture. Half were randomly assigned to take notes on a laptop while the remaining students took notes by hand. Before taking a test to measure conceptual understanding of the lecture, researchers assigned half of each group to review their notes while the other half wasn’t given an opportunity to review. List the explanatory variables and the number of possible values for each variable. If the researchers used every possible combination to form the treatments, how many treatments were included in the experiment? 2. List two of the treatments. 3. Were the subjects (the students) “blind” to what treatment they received? 4.What is the response variable?