what is the conclusion of the test at 5 % level of significance

MATLAB: An Introduction with Applications
6th Edition
ISBN:9781119256830
Author:Amos Gilat
Publisher:Amos Gilat
Chapter1: Starting With Matlab
Section: Chapter Questions
Problem 1P

Related questions
Question
The sample data here is the cholesterol levels for 10 men diagnosed with high cholesterol. The first row represents levels from 10 men who did not use the drug and the second row from 10 different men who did use the drug. If we want to test the claim that the mean level for all men who use the drug is less than the mean for all men who do not use it, using the MS Excel output table below, what is the conclusion of the test at 5 % level of significance? No Drug 237 289 257 228 303 275 262 304 244 233 Drug 194 240 230 186 265 222 242 281 240 212
There is enough evidence that men who use the drug have less cholesterol levels than those men who do not use the drug.
There is not enough evidence that a significant difference exists between males who use the medicine and men who do not use the drug in terms of mean cholesterol levels.
There is not enough evidence men who use the drug have less cholesterol levels than men who do not use the drug.
There is enough evidence that a significant difference exists between males who use the medicine and men who do not use the drug in terms of mean cholesterol levels.
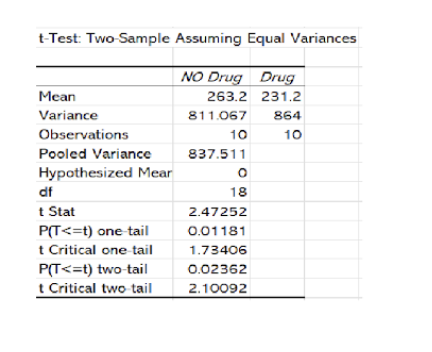
Transcribed Image Text:t-Test: Two Sample Assuming Equal Variances
NO Drug Drug
Mean
263.2 231.2
Variance
811.067
864
Observations
10
10
Pooled Variance
837.511
Hypothesized Mear
df
18
t Stat
2.47252
P(T<=t) one tail
t Critical one tail
P(T<=t) two tail
t Critical two tail
0.01181
1.73406
0.02362
2.10092
Expert Solution
This question has been solved!
Explore an expertly crafted, step-by-step solution for a thorough understanding of key concepts.

Step by step
Solved in 2 steps with 2 images

Recommended textbooks for you
MATLAB: An Introduction with Applications
Statistics
ISBN:
9781119256830
Author:
Amos Gilat
Publisher:
John Wiley & Sons Inc

Probability and Statistics for Engineering and th…
Statistics
ISBN:
9781305251809
Author:
Jay L. Devore
Publisher:
Cengage Learning

Statistics for The Behavioral Sciences (MindTap C…
Statistics
ISBN:
9781305504912
Author:
Frederick J Gravetter, Larry B. Wallnau
Publisher:
Cengage Learning
MATLAB: An Introduction with Applications
Statistics
ISBN:
9781119256830
Author:
Amos Gilat
Publisher:
John Wiley & Sons Inc
Probability and Statistics for Engineering and th…
Statistics
ISBN:
9781305251809
Author:
Jay L. Devore
Publisher:
Cengage Learning
Statistics for The Behavioral Sciences (MindTap C…
Statistics
ISBN:
9781305504912
Author:
Frederick J Gravetter, Larry B. Wallnau
Publisher:
Cengage Learning

Elementary Statistics: Picturing the World (7th E…
Statistics
ISBN:
9780134683416
Author:
Ron Larson, Betsy Farber
Publisher:
PEARSON

The Basic Practice of Statistics
Statistics
ISBN:
9781319042578
Author:
David S. Moore, William I. Notz, Michael A. Fligner
Publisher:
W. H. Freeman

Introduction to the Practice of Statistics
Statistics
ISBN:
9781319013387
Author:
David S. Moore, George P. McCabe, Bruce A. Craig
Publisher:
W. H. Freeman