What is the correlation coefficient of the linear fit of the data shown below, to the nearest hundredth? 8- 6- 4 6. 8. o 0.93 O-1.00 O-0.93 o 1.00 2 4, 2.


Inverse Normal Distribution
The method used for finding the corresponding z-critical value in a normal distribution using the known probability is said to be an inverse normal distribution. The inverse normal distribution is a continuous probability distribution with a family of two parameters.
Mean, Median, Mode
It is a descriptive summary of a data set. It can be defined by using some of the measures. The central tendencies do not provide information regarding individual data from the dataset. However, they give a summary of the data set. The central tendency or measure of central tendency is a central or typical value for a probability distribution.
Z-Scores
A z-score is a unit of measurement used in statistics to describe the position of a raw score in terms of its distance from the mean, measured with reference to standard deviation from the mean. Z-scores are useful in statistics because they allow comparison between two scores that belong to different normal distributions.
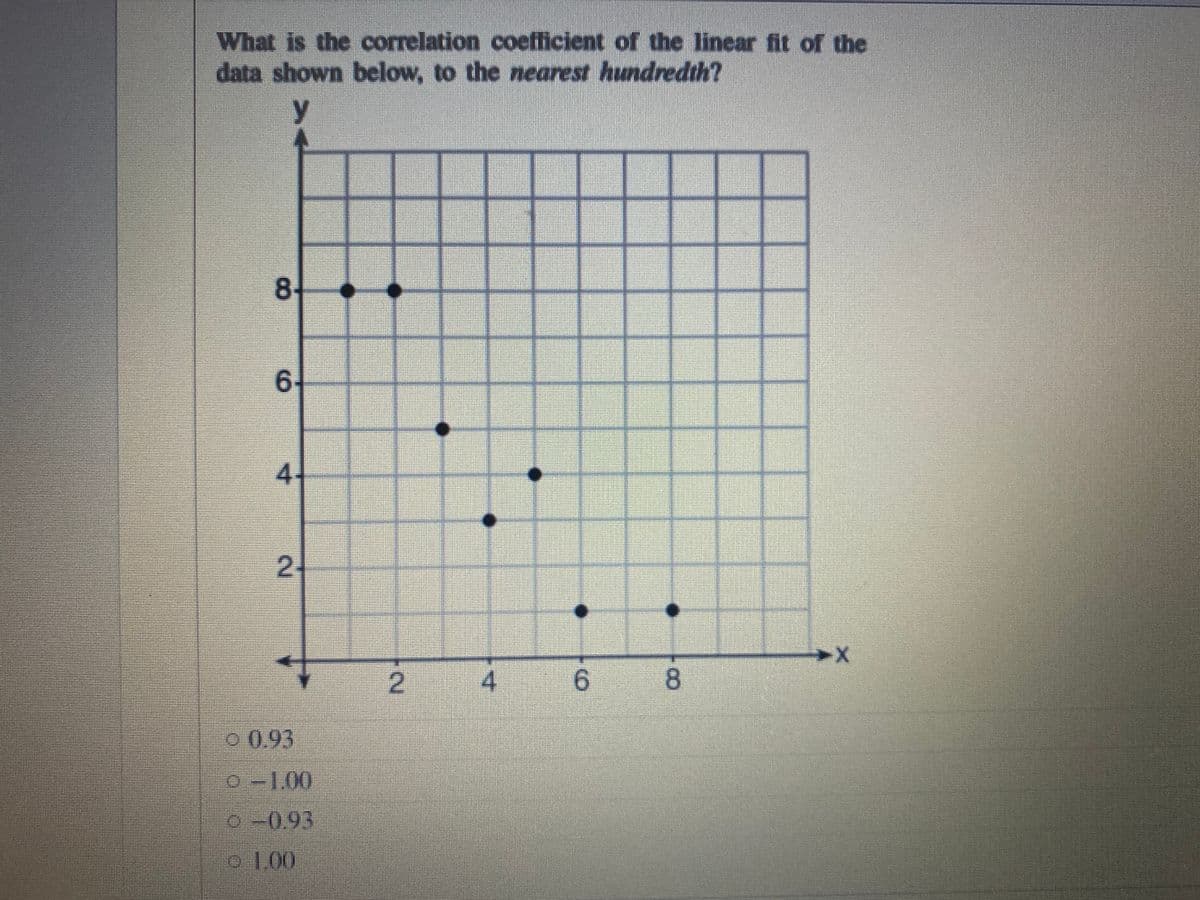
From the scatter plot, the data set (x, y) is (1,8), (2,8), (3,5), (4,3), (5,4), (6,1), (8,1).
Step-by-step procedure to find the correlation coefficient using Excel:
- In Excel sheet, enter Sales in one column and enter Temperature in one column.
- In Data, select Data Analysis and choose Correlation.
- In Input Variable Range, select Sales and Temperature.
- Click Labels.
- Click Ok.
Output obtained using Excel is given below:

From the output, the correlation coefficient r is -0.93.

Trending now
This is a popular solution!

Step by step
Solved in 2 steps with 1 images


