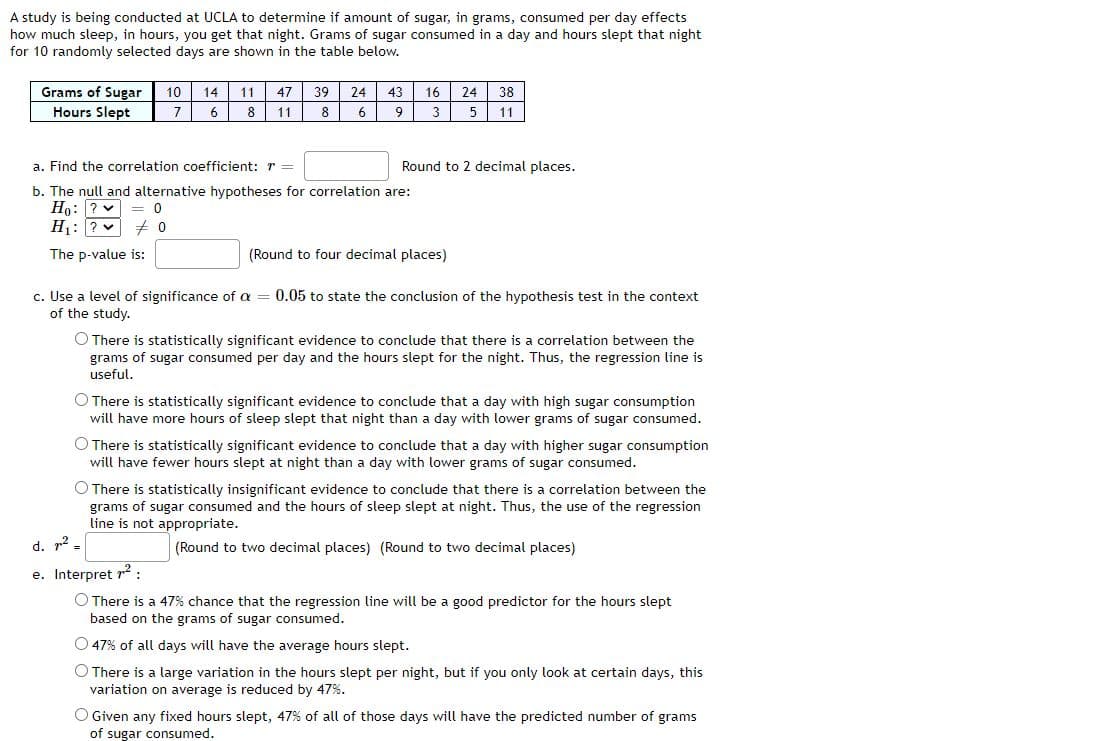
A study is being conducted at UCLA to determine if amount of sugar, in grams, consumed per day effects how much sleep, in hours, you get that night. Grams of sugar consumed in a day and hours slept that night for 10 randomly selected days are shown in the table below. 47 39 24 Grams of Sugar 10 14 Hours Slept 24 38 5 11 11 43 16 7 8 11 8 a. Find the correlation coefficient: r = Round to 2 decimal places. b. The null and alternative hypotheses for correlation are: Ho: ? v = 0 H1: ? + 0 The p-value is: (Round to four decimal places) c. Use a level of significance of a = 0.05 to state the conclusion of the hypothesis test in the context of the study. O There is statistically significant evidence to conclude that there is a correlation between the grams of sugar consumed per day and the hours slept for the night. Thus, the regression line is useful. O There is statistically significant evidence to conclude that a day with high sugar consumption will have more hours of sleep slept that night than a day with lower grams of sugar consumed. There is statistically significant evidence to conclude that a day with higher sugar consumption will have fewer hours slept at night than a day with lower grams of sugar consumed. O There is statistically insignificant evidence to conclude that there is a correlation between the grams of sugar consumed and the hours of sleep slept at night. Thus, the use of the regression line is not appropriate. d. r2 - (Round to two decimal places) (Round to two decimal places) e. Interpret r : O There is a 47% chance that the regression line will be a good predictor for the hours slept based on the grams of sugar consumed. 47% of all days will have the average hours slept. O There is a large variation in the hours slept per night, but if you only look at certain days, this variation on average is reduced by 47%. OGiuon anu 17% of all therg dave nuo tho arame

Glencoe Algebra 1, Student Edition, 9780079039897, 0079039898, 2018
18th Edition
ISBN:9780079039897
Author:Carter
Publisher:Carter
Chapter10: Statistics
Section10.4: Distributions Of Data
Problem 19PFA
icon
Related questions
icon
Concept explainers
Question
A study is being conducted at UCLA to determine if amount of sugar,
grams, consumed per day effects
how much sleep, in hours, you get that night. Grams of sugar consumed in a day and hours slept that night
for 10 randomly selected days are shown in the table below.
Grams of Sugar
Hours Slept
10
14
11
47
39
24
43
16
24
38
7
8
11
8
6
9
3
5
11
a. Find the correlation coefficient: r =
Round to 2 decimal places.
b. The null and alternative hypotheses for correlation are:
Но: ?
H: ? v
= 0
The p-value is:
(Round to four decimal places)
c. Use a level of significance of a
of the study.
0.05 to state the conclusion of the hypothesis test in the context
O There is statistically significant evidence to conclude that there is a correlation between the
grams of sugar consumed per day and the hours slept for the night. Thus, the regression line is
useful.
O There is statistically significant evidence to conclude that a day with high sugar consumption
will have more hours of sleep slept that night than a day with lower grams of sugar consumed.
O There is statistically significant evidence to conclude that a day with higher sugar consumption
fewer hours slept at night than a day with lower grams of sugar consumed.
will
O There is statistically insignificant evidence to conclude that there is a correlation between the
grams of sugar consumed and the hours of sleep slept at night. Thus, the use of the regression
line is not appropriate.
d. p2 =
(Round to two decimal places) (Round to two decimal places)
e. Interpret r2
:
O There is a 47% chance that the regression line will be a good predictor for the hours slept
based on the grams of sugar consumed.
O 47% of all days will have the average hours slept.
O There is a large variation in the hours slept per night, but if you only look at certain days, this
variation on average is reduced by 47%.
O Given any fixed hours slept, 47% of all of those days will have the predicted number of grams
of sugar consumed.
Transcribed Image Text:A study is being conducted at UCLA to determine if amount of sugar, grams, consumed per day effects how much sleep, in hours, you get that night. Grams of sugar consumed in a day and hours slept that night for 10 randomly selected days are shown in the table below. Grams of Sugar Hours Slept 10 14 11 47 39 24 43 16 24 38 7 8 11 8 6 9 3 5 11 a. Find the correlation coefficient: r = Round to 2 decimal places. b. The null and alternative hypotheses for correlation are: Но: ? H: ? v = 0 The p-value is: (Round to four decimal places) c. Use a level of significance of a of the study. 0.05 to state the conclusion of the hypothesis test in the context O There is statistically significant evidence to conclude that there is a correlation between the grams of sugar consumed per day and the hours slept for the night. Thus, the regression line is useful. O There is statistically significant evidence to conclude that a day with high sugar consumption will have more hours of sleep slept that night than a day with lower grams of sugar consumed. O There is statistically significant evidence to conclude that a day with higher sugar consumption fewer hours slept at night than a day with lower grams of sugar consumed. will O There is statistically insignificant evidence to conclude that there is a correlation between the grams of sugar consumed and the hours of sleep slept at night. Thus, the use of the regression line is not appropriate. d. p2 = (Round to two decimal places) (Round to two decimal places) e. Interpret r2 : O There is a 47% chance that the regression line will be a good predictor for the hours slept based on the grams of sugar consumed. O 47% of all days will have the average hours slept. O There is a large variation in the hours slept per night, but if you only look at certain days, this variation on average is reduced by 47%. O Given any fixed hours slept, 47% of all of those days will have the predicted number of grams of sugar consumed.
Expert Solution
trending now

Trending now

This is a popular solution!

steps

Step by step

Solved in 3 steps with 5 images

Blurred answer
Knowledge Booster
Correlation, Regression, and Association
Learn more about
Need a deep-dive on the concept behind this application? Look no further. Learn more about this topic, statistics and related others by exploring similar questions and additional content below.
Recommended textbooks for you
Glencoe Algebra 1, Student Edition, 9780079039897…
Algebra
ISBN:
9780079039897
Author:
Carter
Publisher:
McGraw Hill