What is the hand computation step by step with the guidlines of the software? Your professor is interested in determining if mode of presentation affects how prose material is remembered. She used one prose passage that was presented visually and auditorily. From 200 undergraduate students in the university, only 10agreed to participate. On the first day of the experiment, the 10participants receives visual presentation of the prose passage while on the second day, same participants hears the passages through an auditory presentation. At the end of each presentations, participants were asked to say as much of the material as they can remember within 2 minutes. The words remembered were obtained. Use Student’s tTest for Correlated Groups, alpha at .05 2 tail Visual - 4 2 5 8 2 3 3 2 5 6 Auditory- 4 4 5 9 8 4 4 5 8 6


Inverse Normal Distribution
The method used for finding the corresponding z-critical value in a normal distribution using the known probability is said to be an inverse normal distribution. The inverse normal distribution is a continuous probability distribution with a family of two parameters.
Mean, Median, Mode
It is a descriptive summary of a data set. It can be defined by using some of the measures. The central tendencies do not provide information regarding individual data from the dataset. However, they give a summary of the data set. The central tendency or measure of central tendency is a central or typical value for a probability distribution.
Z-Scores
A z-score is a unit of measurement used in statistics to describe the position of a raw score in terms of its distance from the mean, measured with reference to standard deviation from the mean. Z-scores are useful in statistics because they allow comparison between two scores that belong to different normal distributions.
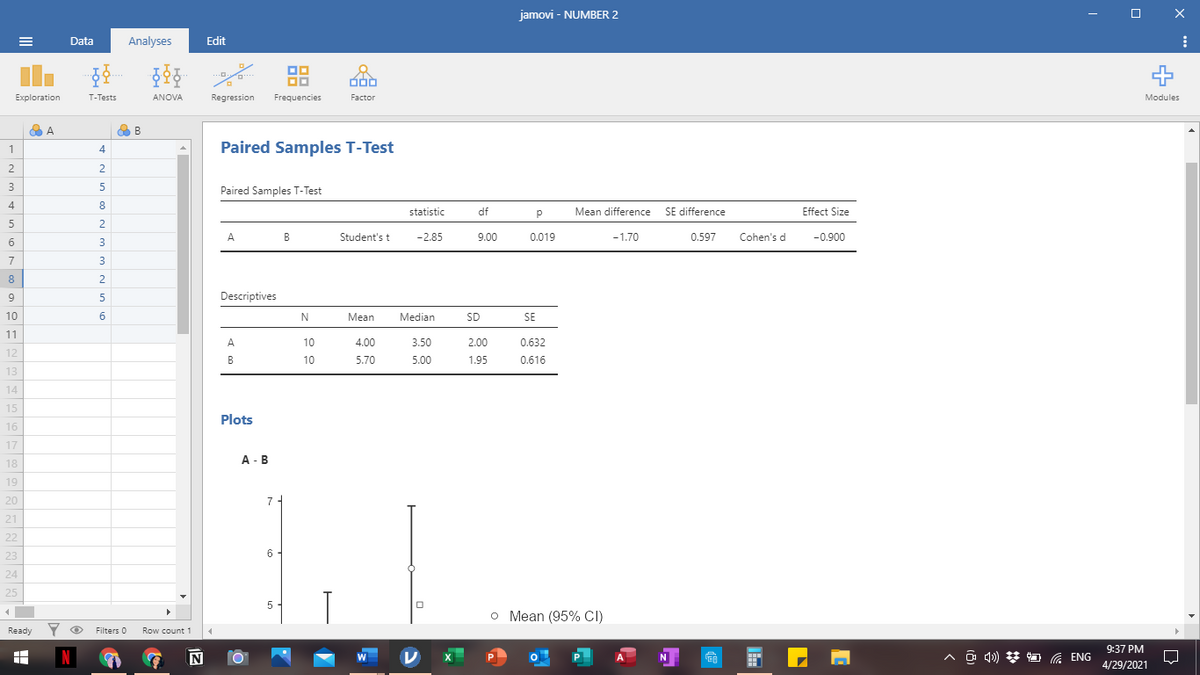
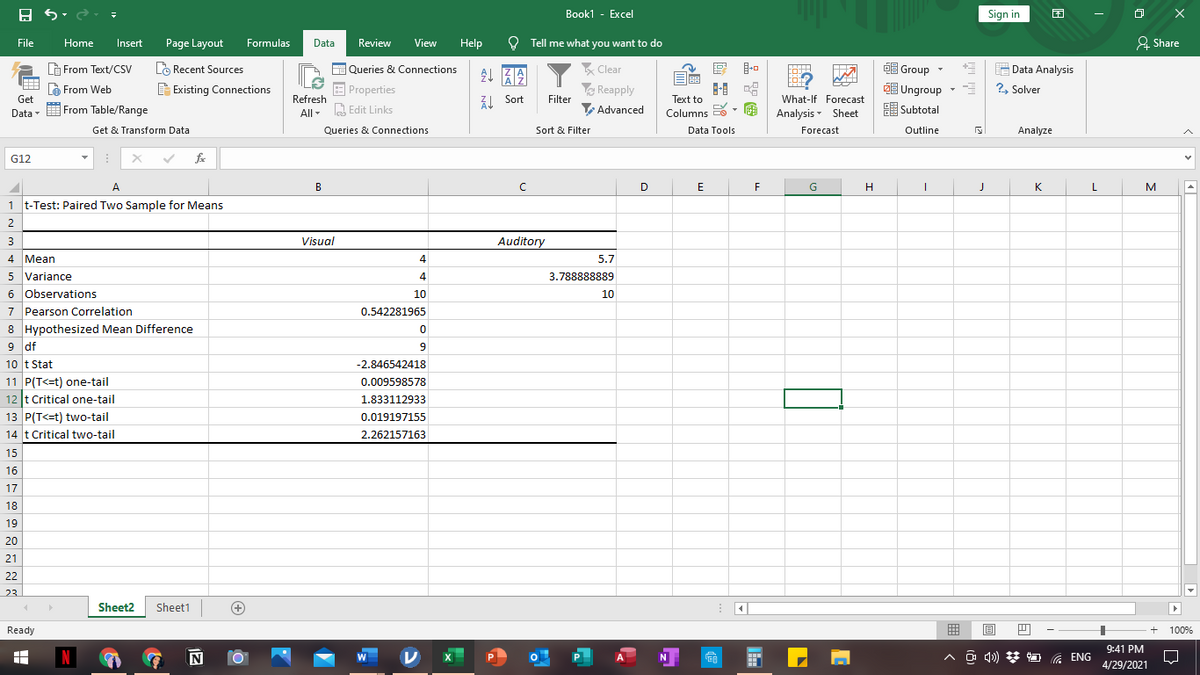
What is the hand computation step by step with the guidlines of the software?
Your professor is interested in determining if
Use Student’s tTest for
Visual - 4 2 5 8 2 3 3 2 5 6
Auditory- 4 4 5 9 8 4 4 5 8 6

Step by step
Solved in 2 steps


