out of 4,135 respondents are worried about a future in which robots and computers can do many human jobs; 2,778 are worried about the development of algorithms that can evaluate and hire job candidates; and 2,235 are worried about the development of Iriverless vehicles. (Round your answers to four decimal places.) (a) Develop a point estimate of the proportion of respondents who are worried about a future in which robots and computer can do many human jobs. (b) Develop a point estimate of the proportion of respondents who are worried that the development of algorithms that can evaluate and hire job candidates. (c) Develop a point estimate of the proportion of respondents who are worried about the development of driverless vehicles.
out of 4,135 respondents are worried about a future in which robots and computers can do many human jobs; 2,778 are worried about the development of algorithms that can evaluate and hire job candidates; and 2,235 are worried about the development of Iriverless vehicles. (Round your answers to four decimal places.) (a) Develop a point estimate of the proportion of respondents who are worried about a future in which robots and computer can do many human jobs. (b) Develop a point estimate of the proportion of respondents who are worried that the development of algorithms that can evaluate and hire job candidates. (c) Develop a point estimate of the proportion of respondents who are worried about the development of driverless vehicles.

Algebra & Trigonometry with Analytic Geometry
13th Edition
ISBN:9781133382119
Author:Swokowski
Publisher:Swokowski
Chapter10: Sequences, Series, And Probability
Section10.2: Arithmetic Sequences
Problem 52E

Related questions

Concept explainers
Contingency Table
A contingency table can be defined as the visual representation of the relationship between two or more categorical variables that can be evaluated and registered. It is a categorical version of the scatterplot, which is used to investigate the linear relationship between two variables. A contingency table is indeed a type of frequency distribution table that displays two variables at the same time.
Binomial Distribution
Binomial is an algebraic expression of the sum or the difference of two terms. Before knowing about binomial distribution, we must know about the binomial theorem.
Topic Video
Question
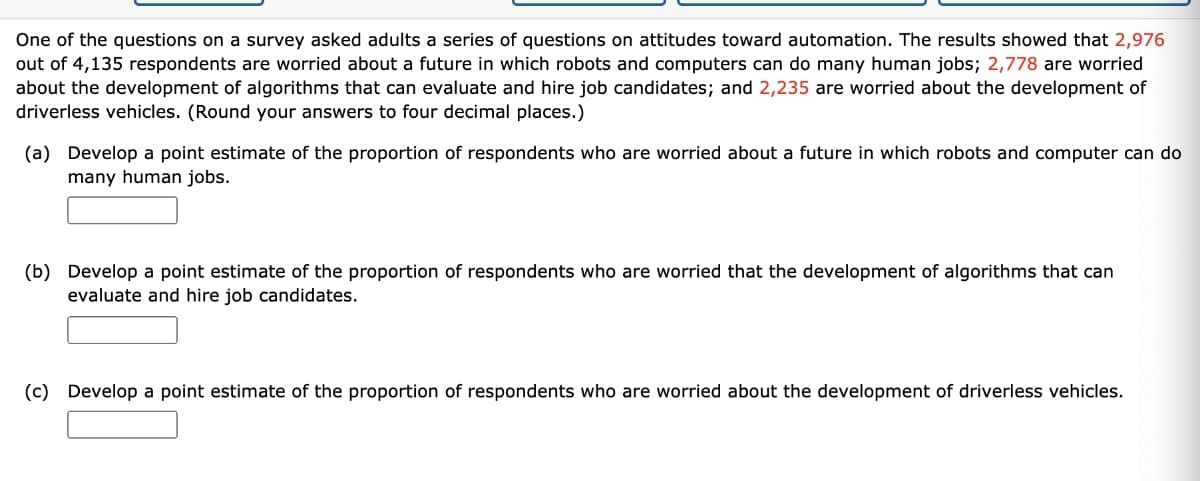
Transcribed Image Text:One of the questions on a survey asked adults a series of questions on attitudes toward automation. The results showed that 2,976
out of 4,135 respondents are worried about a future in which robots and computers can do many human jobs; 2,778 are worried
about the development of algorithms that can evaluate and hire job candidates; and 2,235 are worried about the development of
driverless vehicles. (Round your answers to four decimal places.)
(a) Develop a point estimate of the proportion of respondents who are worried about a future in which robots and computer can do
many human jobs.
(b) Develop a point estimate of the proportion of respondents who are worried that the development of algorithms that can
evaluate and hire job candidates.
(c) Develop a point estimate of the proportion of respondents who are worried about the development of driverless vehicles.
Expert Solution
This question has been solved!
Explore an expertly crafted, step-by-step solution for a thorough understanding of key concepts.

This is a popular solution!

Trending now
This is a popular solution!

Step by step
Solved in 2 steps

Knowledge Booster


Learn more about
Need a deep-dive on the concept behind this application? Look no further. Learn more about this topic, statistics and related others by exploring similar questions and additional content below.Recommended textbooks for you
Algebra & Trigonometry with Analytic Geometry
Algebra
ISBN:
9781133382119
Author:
Swokowski
Publisher:
Cengage
Algebra & Trigonometry with Analytic Geometry
Algebra
ISBN:
9781133382119
Author:
Swokowski
Publisher:
Cengage