what is the maximum number of devices that we would need to randomly select to ensure that the probability of selecting a faulty device is < 2.5%?
what is the maximum number of devices that we would need to randomly select to ensure that the probability of selecting a faulty device is < 2.5%?

Glencoe Algebra 1, Student Edition, 9780079039897, 0079039898, 2018
18th Edition
ISBN:9780079039897
Author:Carter
Publisher:Carter
Chapter10: Statistics
Section10.1: Measures Of Center
Problem 9PPS

Related questions
Question
Q4
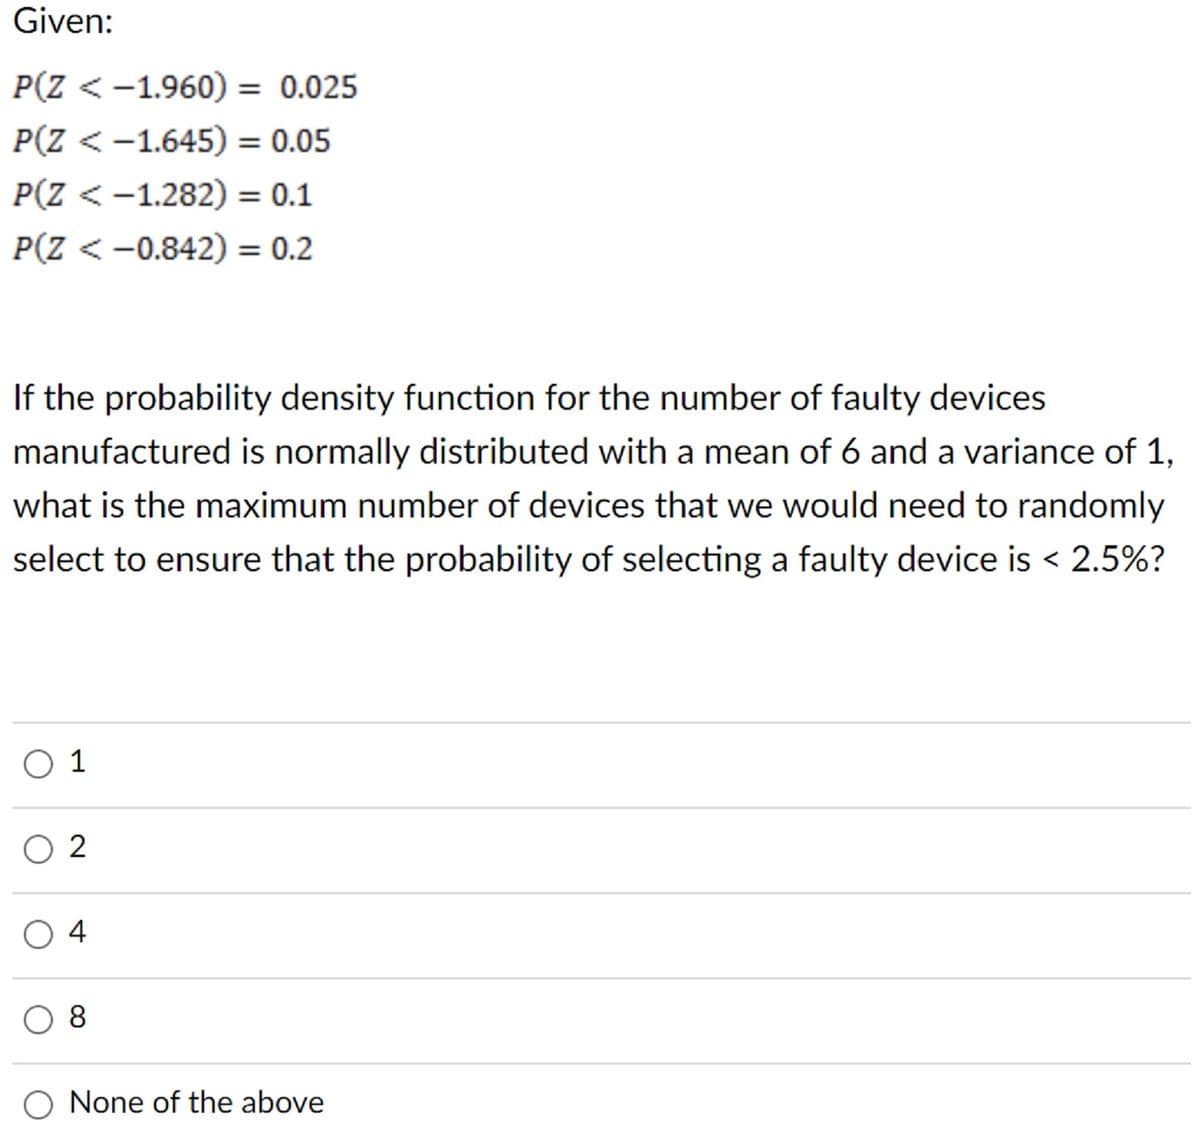
Transcribed Image Text:Given:
P(Z < -1.960) = 0.025
P(Z < -1.645) = 0.05
P(Z < -1.282) = 0.1
P(Z <-0.842) = 0.2
If the probability density function for the number of faulty devices
manufactured is normally distributed with a mean of 6 and a variance of 1,
what is the maximum number of devices that we would need to randomly
select to ensure that the probability of selecting a faulty device is < 2.5%?
01
2
04
8
None of the above
Expert Solution
This question has been solved!
Explore an expertly crafted, step-by-step solution for a thorough understanding of key concepts.

Step by step
Solved in 3 steps with 1 images

Recommended textbooks for you
Glencoe Algebra 1, Student Edition, 9780079039897…
Algebra
ISBN:
9780079039897
Author:
Carter
Publisher:
McGraw Hill
Glencoe Algebra 1, Student Edition, 9780079039897…
Algebra
ISBN:
9780079039897
Author:
Carter
Publisher:
McGraw Hill