What is the Mean Absolute Error? What is the Mean Squared Error? What is the Mean Absolute Percentage Error?


Q: d. Describe how any outlier affects the mean and the standard deviation
A: If X1, X2, ..., Xn are n observations in an experiment, Mean=1n∑i=1nxiStandard…
Q: The mean can be thought of as the balancing point of a distribution. According to this description,…
A: Mean A mean is the simple mathematical average of a set of two or more numbers. The mean…
Q: According to a yahoo!finance article dated September 7, 2021, the top vehicles for resale value had…
A: Solution - Given that the data of top vehicle resale as X : 60% 62% 64% 65% 66%…
Q: Determine the variability of your data set (standard deviation), and the uncertainty of the mean.
A: In variable data set the single data value has an uncertainty that is equal to the standard…
Q: What is a standard abbreviation for the mean?
A: Mean is a measure of center in case of quantitative data.
Q: Please explain and interpret each of the following descriptive statistics for the variable shown in…
A: Following is the descriptive statistics of the data on child weight.
Q: What is the formula for a deviation score from a population?
A: Formula :
Q: What is the best estimate of the mean household income in this county?
A:
Q: Discuss the concepts of Mean, Median, Mode, and Standard Deviation, including when each should be…
A: Mean: The most common measure of central tendency used by peoples is mean. It is also know as the…
Q: What is the mean of the current data set? Show your work using the sketchpad below.
A: Measure of central tendency measures the central or average value of a dataset. Measured of…
Q: Would you be able to help with Standard Deviation along with the range, mean, mode, and median?
A: Measures of variability:The measure of variability or the measures of dispersion can be measured…
Q: For the data described below, identify the level of measurement as nominal, ordinal, interval, or…
A: Q) For the data described below, identify the level of measurement as nominal, ordinal, interval,…
Q: You can calculate an average/mean of qualitative data. True or False
A: mean , median and measure of spread can't be calculated for qualitative data, because no natural…
Q: A battery manufacturer claims that the mean life of a particular type of their batteries is 500…
A: Since , the sample size is 30. Here , we want to test the claim that the actual mean battery life is…
Q: What is the difference between estimated mean and population mean? Thank you
A: Solution Given the difference between estimated mean and population mean
Q: Explain the term "deviation scores"?
A:
Q: what does the shape of the box imply about the concentration of data? use complete sentences
A: In statistics, the box plots are graphical technique that tells us about the concentration of the…
Q: Does this table data include mean, median, or mode? What kind of level of measure is used?
A: The data consists the monthly cost of groceries for college students of 51 states.
Q: The table below presents the actual monthly sales for a company over the first six months of 1986.…
A: The 3-month moving average is, Months Actual Sales 3-Month moving average January 1986 270…
Q: Should averages be taken literally? What are the drawbacks?
A: Average is a summary statistic that represents the center point or typical value of a dataset. It…
Q: For the following data, calculate mean, deviation, standard deviation, median, variance and range
A: x (x-xbar) (x-xbar)^2 16.7724 -0.00054 0.00000029 16.7735 0.000562 0.00000032 16.7722 -0.00074…
Q: Calculate mean deviation from mean and median for the following data: 100, 150, 200, 250, 360, 490,…
A: Solution is given:
Q: Please, find the Arthematic Mean, Geomatric Mean, Harmonic Mean, Mode & Median of the given data.…
A: It is a single value within the range of data which represents a group of individuals values in a…
Q: list the number of expenses for each day and create a graphical representation of the gathered data.…
A: list the number of expenses for each day and create a graphical representation of the gathered data.…
Q: According to a recent article about individuals who have credit cards, the mean number öf čards per…
A: A hypothesis is a statement that defines the relationship between two variables. It makes decisions…
Q: In words, explain what is measured by SS, variance, and standard deviation
A: The sum of squared deviations, , is also known as the sum of squares or SS. The number of squared…
Q: Identify the level of measurement of the data , and explain what is wrong with the given…
A: Nominal: The level of measurement is nominal when the observations are defined in terms of…
Q: Do you agree that standard deviation can measure variable relationships?
A: Yes, Standard deviation can measure variable relationships.
Q: A weight-loss clinic advertised that last month its patients, on average, lost 7 lb. Assuming that…
A: Here Given Weight loss clinic advertised that last month its patients On average lost 7 lb.
Q: Identify which of the following are the correct symbol and value for the point estimate of the…
A: Point estimate of population mean is sample mean
Q: A scientist studying babies born prematurely would like to obtain a n estimate for the mean birth…
A: It is given that confidence level is 0.99, standard deviation is 2.5 and the margin of error E is…
Q: Define the following terms and write down their formulas ? Statistics, Primary data, secondary…
A: Statistics It is a study of collection, manipulation and review of the data. It also involves the…
Q: How to find the relative and percent error in this data?
A: From the given data the equation is of linear type in the form of a line equation Y = a+bX The line…
Q: 26 26 22 27 28 14 8 21 7 27 11 10 7 22 25 Question 1 What is the median for the above-mentioned…
A:
Q: The percentile corresponding to the data value 25 is
A: Percentile is the location measure. It divide the data set into 100 equal parts with 99 points.…
Q: The first step in finding the interquartile range involves calculating the ____ of the data set. a.…
A: Solution-: The first step in finding the interquartile range involves calculating the ____ of the…
Q: The Centers for Disease Control and Prevention recommends that adults get between 7-8 hours of sleep…
A: The median is middle value of the ordered data set.
Q: Find the precise median for the following scores measuring a continuous variable. Scores:…
A: Here the size of the sample is even (8). So we use the given formula to calculate median, Median= {…
Q: Please discuss the concepts of Mean, Median, Mode, and Standard Deviation, including when each…
A: Given data To dis cuss the concepts of mean, median , mode and standard deviation
Q: Identify the line most likely to graphically represent the mean, median and ode of the distribution?…
A: It is an important part of statistics. It is widely used.
Q: Some students were asked about the amounts of their daily allowances, and their responses were…
A: A data is given. We need to find the mean. The solution is explained below.
Q: Find the mean, median, and mode of the data, if possible. If any of these measures cannot be found…
A:
Q: a) Explain why this histogram follows a normal distribution? b) Based on the histogram, how many…
A: a) According to the law of central limit theorem as the number of n increases the data transforms…
Q: A mother is creating the family budget for next year and wants to come up with a single value to…
A: Identify the correct option that correctly describes the data. The correct option is identified…
Q: The Centers for Disease Control and Prevention recommends that adults get between 7-8 hours of sleep…
A: We have given that Dot plot We want to find median. Median = middle value of the data set.
Q: What is the level of Measurement and type of data?
A: Level of measurement describes the nature of data The four levels of measurement are : nominal,…
Q: When you have significant results in data analysis, it is customary to report all relevant means and…
A: Data Analysics is a process of inspecting, cleansing, transforming, and modeling data with the goal…
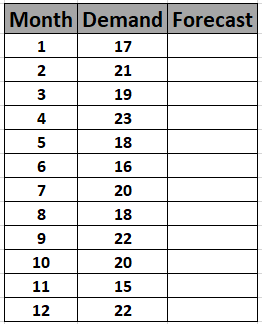
Below is the data for the demand of bottled water for the year. Complete the table using a 3-month moving average forecasting.


Trending now
This is a popular solution!

Step by step
Solved in 3 steps with 3 images

- Calculate MSE for the 4 periods for which the actual and forecasted number of customers given in the table below: Period Actual Number of Customers Forecasted Number of Customers Error 1 1,975 2,000 2 2,050 2,025 3 1,925 1,975 4 2,075 2,025 0 390.63 37.5 6,250 1,562.5Find the 3 year period moving average for 2008Ivanhoe Company uses a periodic inventory system. Its records show the following for the month of May, in which 70 units were sold. Date Explanation Units Unit Cost Total Cost May 1 Inventory 33 $10 $330 15 Purchase 27 11 297 24 Purchase 40 12 480 Total 100 $1,107
- House of coffees imports and distributes coffee to over 300 retailers countrywide. Data for 2007 and 2010 is shown in the table below. Calculate the Laspeyres Quantity Index using 2001 as the base year (rounded off to two deccimals)NRR: Net Reproduction RateA car dealership keeps track of how much it spends on advertising each month and of its monthly revenue. From this information, the list of advertising expenditures and probable associated revenues are shown in the table below.
- Johnson Wholesale Company manufactures a variety of products. The prices and quantities produced for April 2010 and April 2019 are: 2010 2019 2010 Quantity 2019 Quantity Product Price Price Produced Produced Small motor (each) $ 23.92 $ 28.29 1,413 4,234 Scrubbing compound (gallon) 2.32 3.70 86,827 62,984 Nails (pound) 0.19 0.86 9,332 22,336 Click here for the Excel Data FileUsing April 2010 as the base period, find the value index of goods produced for April 2019. (Round your answer to 2 decimal places.)Discuss the relationship between advertising expenditure and sales revenue.Use the Naïve method to forecast enrollment in Spring 2022 Use the average method to forecast enrollment in Spring 2022 Use the MA3 method (moving average 3 periods) to forecast enrollment in Spring 2022
- Calculate the average inventory (in $) and inventory turnover ratio for the given company. (Round the inventory turnover ratio to one decimal place.) Company BeginningInventory EndingInventory AverageInventory Cost ofGoods Sold InventoryTurnover a hardware store $315,220 $300,070 $ $4,856,470Based on the number of claims filed, a homeowners insurance company periodically reevaluates its premiums. It will either increase or decrease its premiums for all customers. Which measure provides the best information for its reevaluation? A. claims per dollar value of property B. claims per year per city C. claims per year D. claims per sub-divisiona) Produce an appropriate fully labelled chart to reflect the quarterly totals for each region. b) Use a suitable and fully labelled chart to reflect the contribution of each region to the overall project annual revenue.