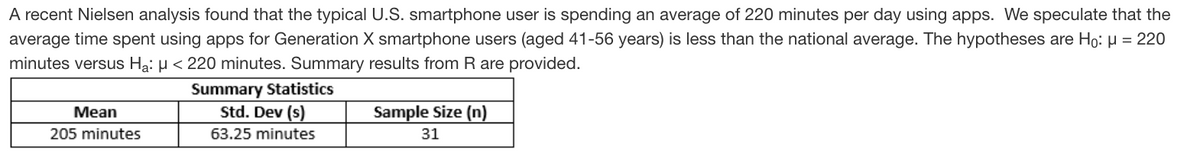
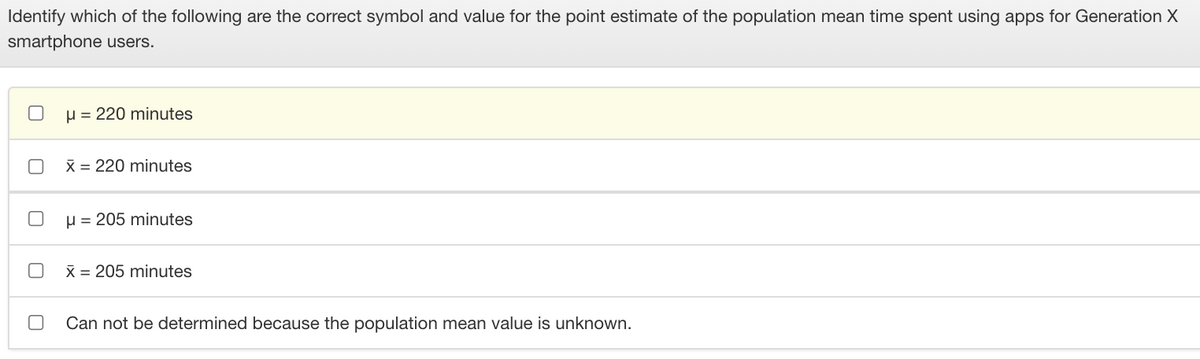
Identify which of the following are the correct symbol and value for the point estimate of the population mean time spent using apps for Generation X smartphone users.


Q: Based on the histogram, draw the ogive (the cumulative frequency polygon) for the data from the…
A: The cumulative frequency is, Daily Methadone dosage Frequency Cumulative frequency 0 - 49 3 3…
Q: The mean can be thought of as the balancing point of a distribution. According to this description,…
A: Mean A mean is the simple mathematical average of a set of two or more numbers. The mean…
Q: A climatologist is interested in the possibility that the strength of the sun change over time. A…
A: Test is that whether the strength of the sun change overtime. Note : Since you have asked multiple…
Q: A researcher wants to know if there is a difference between the mean amount of sleep that people get…
A: 2. Excel Procedure: Enter the data for Part Time, Unemployed and Full Time in Excel sheet>…
Q: prove that If we add a constant (say, d) for all data values, Geometric mean Value will be affected.…
A: Geometric mean of a data distribution a1, a2, a3,..,an is nth square root of product of all data…
Q: The total rainfall for a certain year is 13.2. What was the mean monthly rainfall?
A:
Q: Calculate the median of the data shown, to two decimal places
A: Median is the value which divides tye whole data in two equal halves.
Q: Define the term Mean & median? Illustrate their symbols?
A: Mean Mean is the most widely used measure of Central Tendency that is used in Statistical analyses.…
Q: The national mean annual salary for a school administrator is $90,000 a year. A school official took…
A:
Q: Are any of the leaf measurements from the table the same as the mean? How many of the leaves were…
A: Given Sample size, n=20 Oak-Leaf Lengths: 78,69,62,74,69,51,45,40,9,64,65,64,61,69,52,60,66,71,72,27…
Q: Based on this histogram, draw the ogive (the cumulative frequency polygon) for the Accu-Rating data.
A:
Q: Based on this histogram, draw the ogive (the cumulative relative frequency polygon) for the data.
A: By using the given histogram, the cumulative relative frequency is, Selling time Relative…
Q: Discuss the concepts of Mean, Median, Mode, and Standard Deviation, including when each should be…
A: Mean- It is the average value of the data set and is calculated by the sum of the data set divided…
Q: Find the range and standard deviation of the set of data. 77,88,1212,1414,1717,2020
A: Solution: The range of the data is calculated as follows:
Q: Which of the following is(are) TRUE? * I. Based on the sample of 654 young adults, a point estimate…
A: From the output, 95% confidence interval is, (13.572, 15.872) Interpretation: There is a 95% chance…
Q: Identify research topics that are well suited for survey research.
A: In survey, the responses given by individuals to questions are collected.
Q: A battery manufacturer claims that the mean life of a particular type of their batteries is 500…
A: Since , the sample size is 30. Here , we want to test the claim that the actual mean battery life is…
Q: Among fatal plane crashes that occurred during the past 60 years, 580 were due to pilot error, 52…
A: The given data is Cause Frequency Pilot error 580 Other human error 52 Weather 169…
Q: In any data set, what percent of data lies within 8 standard deviations of the mean
A: Given: In any data set, what percent of data lies within 8 standard deviations of the mean??
Q: The mean age of a group as 100 persons was found to be 32-02. Later it was discovered that age 57…
A:
Q: The table below shows the observed pollution indexes of air samples in two areas of a city. Test the…
A: Null and alternative hypothesis: Given data represents the observed pollution indexes of air samples…
Q: If educational level is measured as "Did not graduate from high school" and "graduated from high…
A: The level of measurement is Ordinal Scale. The ordinal type of measurement allows for rank order by…
Q: Use your cumulative frequency diagram to estimate (i) the median value
A: The provided frequency distribution is Class Frequency (f) cf 16-25 8 8 26-35 32 40 36-45…
Q: The relative risk of developing lung cancer among individuals who smoke is 15.0. Which of the…
A: Relative risk is the ratio of probability of an outcome in an exposed group to the probability of an…
Q: Determine whether the variables is qualitative or quantitative number of infants born in a month
A: Let QlV denote qualitative variable. Let QnV denote quantitative variable.
Q: Use your favorite search engine to find 10 daytime high temperatures from where you live. After…
A:
Q: Given the mean of a certain data set as 155, what will be its new mean if all the data points were…
A: Remark: We know that, The mean (average) of a data set is found by adding all numbers in the data…
Q: If we add a constant (say, d) for all data values, how this will affect the geometric mean ? Give…
A: Consider that x1, x2, x3, x4, x5, …. xn, are the data values. Thus, the GM (geometric men) can be…
Q: Calculate mean froim following data keeping in view the
A: Mean = Mean is a sum of observations divided by number of observations. Mean = Σ(fi * Xi)/Σfi
Q: erage, taller today than they were 200 years ago. Today, the mean height of
A: The given data: Height (in inches) Percent of boys Under 50 0.2 50-54 7.0 55-59 46.0…
Q: Follow the graph and solve Compute the mean number of shipping days Compute the median number of…
A: Given that, The dataset of the variable “number of shipment days” is given below:
Q: Give the statistical meaning of the relationship between the spending hours on using mobile and…
A: Answer: When we check the relationship between two variables then scatter plot is best plot to…
Q: In a certain year, just the top six countries accounted for over 55% of cell phone subscriptions…
A: Given, Numbar of countries = 6 Total number of cell phone subscriptions: Total =…
Q: Which measure remains the same if 102 is remnoved from the data set below? {19, 20, 23, 23, 25, 28,…
A:
Q: 4. Mr. Gomez travelled 525 km in 6 h. a) What was the mean distance travelled in 1 h? b) How is the…
A: this is the problem of basic physic question. we will solve it by busing velocitry property.
Q: A weight-loss clinic advertised that last month its patients, on average, lost 7 lb. Assuming that…
A: Here Given Weight loss clinic advertised that last month its patients On average lost 7 lb.
Q: Researchers wished to know if they could conclude that two populations of infants differ with…
A:
Q: If a sample of 23 swimmers is taken from a population of 74 swimmers, the population mean u is the…
A: Given data: If a sample of 23 swimmers is taken from a population of 74 swimmers. To find: The…
Q: state whether the parameter of interest is a mean or a proportion: in a survey, high school and…
A: Statement = " In a survey, high school and college students are asked whether or not they use…
Q: Determine the interquartile range of the following data: 155, 134, 153, 119, 89.
A: Arrange the data in ascending order as 34, 35,, 45, 89, 119, 134, 153, 155
Q: Based on this histogram, draw the ogive (the cumulative relative frequency polygon) for the data in…
A: From provided histogram, the table of frequency distribution can be written as: Classes…
Q: a population has mean score of 50 if five points are added to each score what is the new mean
A: GivenThe population mean = 50Mean is the average of all the data points in the data distribution. It…
Q: A scientist studying babies born prematurely would like to obtain a n estimate for the mean birth…
A: It is given that confidence level is 0.99, standard deviation is 2.5 and the margin of error E is…
Q: Find the mean ,median, and mode of the following data. If necessary round one or more decimal place…
A: Given data…
Q: Define the following terms and write down their formulas ? Statistics, Primary data, secondary…
A: Statistics It is a study of collection, manipulation and review of the data. It also involves the…
Q: The mean # of hours worked
A: To find the mean number of hours worked by college students outside the home: Mean is a measure of…
Q: This subject is in Social Stats explain frequency distribution, show explains
A: Frequency:The frequency of a particular data value is the number of times the data value…
Q: Please discuss the concepts of Mean, Median, Mode, and Standard Deviation, including when each…
A: Given data To dis cuss the concepts of mean, median , mode and standard deviation
Q: Give the statistical meaning of the relationship between the spending hours on using mobile and…
A: Solution: n= 10 observation let x=Using phone days and y= using reading days x y x^2 y^2 xy…


Trending now
This is a popular solution!

Step by step
Solved in 2 steps

- For each effect, state whether the null hypothesis was rejected or not. Calculate the effect size for the effect of stressResearchers interested in lead exposure due to car exhaust sampled the blood of 52 police officers subjected to constant inhalation of automobile exhaust fumes while working traffic enforcement in a primarily urban environment. The blood samples of these officers had an average lead concentration of 124.32 µg/l and an SD of 37.74 µg/l; a previous study of individuals from a nearby suburb, with no history of exposure, found an average blood level concentration of 35 µg/l. Write down the hypotheses that would be appropriate for testing if the police officers appear to have been exposed to a higher concentration of lead. Explicitly state and check all conditions necessary for inference on these data. Test the hypothesis that the downtown police officers have a higher lead exposure than the group in the previous study. Interpret your results in context. Based on your preceding result, without performing a calculation, would a 99% confidence interval for the average blood concentration…An econometrician suspects that the residuals of her model might be autocorrelated. Explain the steps involved in testing this theory using the Durbin–Watson (DW) test
- The article “Effect of Varying Solids Concentration and Organic Loading on the Performance of Temperature Phased Anaerobic Digestion Process” (S. Vandenburgh and T. Ellis, Water Environment Research, 2002:142–148) discusses experiments to determine the effect of the solids concentration on the performance of treatment methods for wastewater sludge. In the first experiment, the concentration of solids (in g/L) was 43.94 ± 1.18. In the second experiment, which was independent of the first, the concentration was 48.66 ± 1.76. Estimate the difference in the concentration between the two experiments, and find the uncertainty in the estimate.A researcher hypothesizes that in a certain country the net annual growth of private sector purchases of government bonds, B, is positively related to the nominal rate of interest on the bonds, NI, and negatively related to the rate of inflation Π: Bt = a0 + a1NIt + a2Π t + ut Note that it may be hypothesized that B depends on the real rate of interest on bonds, R, where R = NI – Π. Using a sample of 56 annual observations, s/he estimates the following equations: (1) Bt = 0.43 + 0.90NIt - 0.97Πt R21 = 0.962, SSR1 = 2.20, QRESET(F1,52) = 16.6 (3.58) (8.80) (-1.05) (2) Bt = 0.44 + 0.94Rt R22 = 0.960, SSR2 = 2.22, QRESET(F1,53) = 0.9 (9.70) (16.7) (3) Bt = 0.44 + 1.14NIt SSR3 = 9.20, QRESET(F1,53) = 59.9 (8.84) (36.1) (4) NIt = 0.08 + 0.94Πt R24 = 0.997, SSR4 = 0.18, QRESET(F1,53) = 1.4…Consider a cohort study to compare the mortality rate of myocardial infarction (MI) in men with sedentary work (exposed group) to men with physically active work (unexposed). If in the exposed, there were 36,000 person (man) years of observation and 126 deaths whereas the unexposed had 24,000 man-years of observation and 44 deaths. Compute the following a) Mortality rate in each cohort? b) What is the relative risk of dying, comparing these 2 groups? c) What is the attributable risk of sedentary work? d) What is the attributable benefit of physical activity? e) If we assume that MI is associated with the mortality in this cohort (causality), what proportion of the disease in the higher group is potentially preventable?
- Compare the two separate scatterplots. In particular, how do the associtation compare between women with pets vs. women without pets? Does one group have more variation in systolic blood pressure than the other? If so, for which group? Does systolic blood pressure seem higher for common ages between the two groups? If so, for which group?In a recent survey, ice cream truck drivers in Cincinnati, Ohio, reported that they make about $280 in income on a typical summer day. The income was generally higher on days with longer work hours, particularly hot days, and on holidays. The accompanying data file includes five weeks of the driver’s daily income (Income), number of hours on the road (Hours), whether it was a particularly hot day (Hot = 1 if the high temperature was above 85°F, 0 otherwise), and whether it was a Holiday (Holiday = 1, 0 otherwise). Income Hours Hot Holiday 196 5 1 0 282 8 0 0 318 6 1 0 232 5 1 0 276 8 0 0 312 8 0 1 193 5 0 1 110 4 0 0 321 8 1 0 283 8 0 0 325 8 1 0 247 7 0 1 398 8 1 1 448 8 1 1 214 4 0 0 235 8 0 0 238 8 0 0 148 3 1 0 313 8 0 1 449 8 1 1 332 8 1 1 247 8 0 0 363 7 1 0 393 7 1 1 254 8 0 0 228 8 0 0 355 6 1 1 248 7 0 1 291 8 1 0 255 5 1 0 239 6 0 0 181 6 0 0 222 7 0 0 170 5 0 1 374 6 1 1 1. Estimate the effect of…In a summary report given by Ing. Pobbi on the lengths of ironrods produced by two machines, he stated that the variability ofmachine A was higher compared to that of machine B. Critiquethe report of the Engineer given data on the length of rodsproduced given as; MachineA(cm): 380 410 280 310 305 360 270 355 400 Machine B(m): 1.1 1.3 1.2 2.0 1.5 1.6 1.4 1.6 1.7
- In the following model, "employed" is a dummy indicating a person is employed: donation = B + B edu + Bemployed + uT Running this model will produce the same results of differential in donation between employed people and unemployed people as running two separate regressions for employed people and unemployed people. A. True B. FalseConsider the following: In general, when people diet they typically lose 10 lbs. (?σ = 2). A random sample of 16 people on the keto diet lost 15 lbs. Do people on the keto diet lose more or less weight than people on diets in general? 3. What is the Null Hypothesis? a)On average, weight loss in the keto diet sample does not differ from weight loss in the population of dieters in general. (H0: X-bar = Mu)) b)On average, weight loss in the keto diet sample does not differ from weight loss in the population of dieters in general. (H0: X-bar does not equal Mu) c)On average, weight loss in the keto diet sample differs from weight loss in the population of dieters in general. (H0: X-bar does not equal Mu) d)On average, weight loss in the keto diet sample differs from weight loss in the population of dieters in general. (H0: X-bar = Mu)andres asked if there is a relationship between the quality of sneakers worn by a sample of 20 volleyball players and their average number of point scored per game. he computed r= +.21 and immediately claimed he had evidence that better-quality sneakers are related to better performance (a) is his claim correct? why? (b) what are Ho and Ha? (c) with alpha=.05, what is rcrit ?
