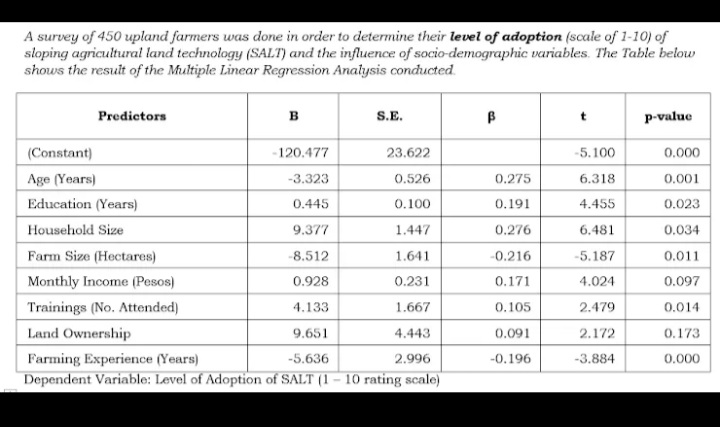
What is the most important predictor in terms of contribution to the dependent variable? 2. Which of the following is not a significant predictor at 5%? 3. Which of the following is the best predictor?


Q: In 1970, 590 students among 1000 randomly selected college freshmen thought that capital punishment…
A: Given data : x1= 590 n1= 1000 x2= 480 n2= 1000
Q: THE PERFORMANCE OF A COMPUTER IS OBSERVED OVER A PERIOD OF * 2 YEARS TO CHECK THE CLAIM THAT THE…
A: Given that N=104 weeks
Q: IN A CITY 250 MEN OUT OF 750 WERE FOUND TO B
A: Hello! As you have posted 2 different questions, we are answering the first question. In case you…
Q: Q3. A company for fuel stations wanted to check two fuel pumps since there was a doubt that there is…
A:
Q: 1. Use a two-sample t test to investigate whether the average June precipitation and pressure in El…
A:
Q: Suppose you wanted to poll citizens of the U.S. and Canada to estimate the number of people who…
A: Research Methodology: A research methodology is a description of how a certain type of study is…
Q: A large sample of children was followed over time. One investigator looked at all the children who…
A: Given information: One investigator looked at all the children who were at the 90th percentile in…
Q: a finacial analysit tested whether the mean growth rates of small companies that recived covid19…
A: Hypothesis testing is an inferential procedure to test the significant difference between population…
Q: The following table shows the number of individuals in a sample of 780 who indicated they support…
A: Formula : Expected frequency = np
Q: Sharlene, the risk manager of Chief Rocking Records, has been asked to assist the corporate strategy…
A:
Q: The trend and shape of this scatterplot displaying the ages of husbands and wives is: O a. Negative…
A: Given the scatter plot of Husbands and Wives. We need to answer, the trend and shape of this…
Q: A nutritionist claims that the mean tuna consumption by a person is 3.8 pounds per year. A sample of…
A: Given n=70 Mean=3.5 Standard deviations=1.17
Q: A life insurance company will sell a $200,000 one-year term life insurance policy to an individual…
A:
Q: True or false Systematic sampling is preferable to convenience sampling.
A: Systematic sampling: Systematic sampling involves of first considering a starting point for…
Q: A Moving to another quest Question 27 Provide an appropriate response. In order for applicants to…
A: From the provided information, x y 3 61 4 68 4 75 5 82 3 73…
Q: THE CRITICAL VALUE FOR TWO TAILED TEST AT 5% LEVEL OF SIGNIFICANCE IS Your answer
A:
Q: you compute a two-sample z statistic and it comes out to equal 1.6. What is the p-value if you are…
A:
Q: A fair die is rolled 624 times. If there are 100 aces (one dot), that means the observed percentage…
A:
Q: certain type of cabbage has a mass M which is normally distributed with mean 900 g and standard…
A: Let X be the random variable from normal distribution with mean (μ) = 850 g and standard deviation…
Q: Suppose two sections of the same class take the same exam and produce the results shown in the…
A: The relative frequency distribution of section 1 scores and section 2 scores, are given.
Q: A total of 240 students enrolled in one of two STAT 250 sections-one meeting during the day and one…
A:
Q: Use the accompanying data set to complete the following actions. a. Find the quartiles. b. Find the…
A: From the provided information, The number of observations (n) = 15
Q: 3. Twe procewo A and 8, were ued to proaduce stainless steel shafts in an industrial company.…
A:
Q: (b) Alice and Bob are playing a game of chance consisting of repeated rounds in which each has an…
A:
Q: 1. What is the t-value of the t-distribution with a 1% and n-18 under the one-tailed test?
A: Given that 1. What is the t-value of the t-distribution with a 1% and n = 18 under the one-tailed…
Q: U s i n g t h e t h i r d c o l u m n of t h e Ta b l e o f R a n d om N u mb e r…
A: Given information: Note: As per guidelines we will solve the first question only, please repost…
Q: In two sets of variables X and Y with 50 observations each, the following data were observed X = 10,…
A: Given that the Coeficient of correlation between X and Y is 0.3. However, on subsequent…
Q: A large sample of children was followed over time. One investigator looked at all the children who…
A: Percentile: Percentile is the percentage of data values that lies below a particular data value.…
Q: One hundred draws are made at random with replacement from a box with the following 4 tickets: 1, 2,…
A: Given Information: Consider the given information in which one hundred draws are made at random with…
Q: Calculate my average exam 1=35 exam 2= 47 exam 3=67 exam 4= 80.625 homework 1b = 95.14…
A: Given Information: Consider the given data: exam 1 35 exam 2 47 exam 3 67 exam 4 80.625…
Q: John and Fred agree to play a series of tennis games. The first one to win three games is declared…
A:
Q: 2. What is the area under the t-distribution from t=-1.771 to t-2.160 at df-13
A: P(-1.771<t<2.160)=? df=13
Q: d weakness identified
A: BLL 69 45 49 84 48 58 17 76 61 78 48 57 68 26 78 56 54 73 74…
Q: 4) Let X have the p.m.f. f(r; 8) = 0" (1 – 0)*-z, x = 0,1. We test Ho : 0 = 0.5 vs. Ha : 0 < 0.5 by…
A:
Q: Rescarch has shown that specific biochemical markers are found exclusively in the breath of patients…
A: Statisticians use the concept of conditional probability to obtain the sensitivity of a diagnostic…
Q: Announcements for 84 upcoming engineering conferences were randomly picked from a stack of IEEE…
A: Solution-: Given: n=84,x¯=3.94,s=1.28 We want to (1) In words define the random variable X and X¯ ?…
Q: Support Oppose Unsure Total Males males Total 174 331 8 513 239 308 19 566 413 639 27 1079 he…
A: Given P(opposed the tax)=639/1079 P(is female)=566/1079 P(opposed the tax is a female)=308/1079
Q: Which of the following is a characteristic of the sampling distribution of a sample mean? O a. It is…
A: The set or collection of all possible observations is defined as the population.
Q: The boxplots below represent movie runtimes (the length of a movie in minutes) for a random sample…
A: The given boxplots represent movie runtimes for a random sample of 100 movies in each of the four…
Q: Choose the correct answer below. O A. The statement does not make sense because an event having two…
A: It might be rai tomorrow or it might not be rain tomorrow, is a statement. So, if one says that…
Q: Distribution of Song Length for 23 Rock and 23 Rap Songs Variable Rap Song Length- Rock Song Length…
A: T-distribution - * population should be normally distributed * population standard deviation should…
Q: In general, if a decision was made to reject the null hypothesis, one can conclude that: O a. There…
A: In general ,if a decision was made to reject the null hypothesis, one can conclude that:
Q: Which of the following statements regarding the widths of bars in a histogram is true? O a. Widths…
A: Number of bins are the interval that contains a particular range of data within that interval.
Q: Exl Let x Beta Cxr B) Finel Location Sacale fremi2a lor B distribution
A: Given that X follows Beta distribution We have to find location and scale family of beta…
Q: You wish to test the following claim (Ha) at a significance level of α=0.001. Ho:p=0.12…
A:
Q: Two cards are selected from a standard deck of 52 playing cards. The first card is not replaced…
A: There are 13 diamond and 13 heart cards in a deck of 52 cards.
Q: Given the table below, use your calculator to find the Correlation Coefficient xx 7.1 9.6 8.9 4.5…
A: We have given that, X :- 7.1, 9.6, 8.9, 4.5, 2.9, 4.4 Y:- 17.9, 25, 22.4, 18.6, 12.3, 15.9 Then,…
Q: Please find the numerical value of the area under the normal curve given the following information:…
A: The objective is to find the numerical value of the area under the normal curve which doesn't lie…
Q: A geography test was given to a simple random sample of 500 high-school students in a certain large…
A: Given information: A geography test was given to a simple random sample of 500 high-school students…
Q: The table below show data that has been collected from different fields from various farms in a…
A: A) In this case, the independent variable is the weight of the Raspberries (x) and the dependent…

Step by step
Solved in 3 steps

- If your graphing calculator is capable of computing a least-squares sinusoidal regression model, use it to find a second model for the data. Graph this new equation along with your first model. How do they compare?Show that an interaction term of a dummy variable and a regressor changes the slope of a regression line..A rural state wants to encourage high school graduates to continue their education and attend college. The state collected information on a random sample of high school seniors from across the state 7 years ago and is now observing how many years of education they completed. They believe students decide to achieve more education when they are more capable, have easier access to college education, and the opportunity cost of attending are lower. To explore the factors that affect the years of education completed they have used multiple regression to estimate the years of completed education as a function of: Unemployment rate - the unemployment rate in the county (3.9 – 16.8) County Hr Wage - average starting hourly manufacturing wage in the county Test - student score on college admission test (0 to 100 scale) Dist to college - Distance to near college (measured in 100’s of miles) Tuition - Tuition charged at nearest state university (measured in $1000s)…
- A rural state wants to encourage high school graduates to continue their education and attend college. The state collected information on a random sample of high school seniors from across the state 7 years ago and is now observing how many years of education they completed. They believe students decide to achieve more education when they are more capable, have easier access to college education, and the opportunity cost of attending are lower. To explore the factors that affect the years of education completed they have used multiple regression to estimate the years of completed education as a function of: Unemployment rate - the unemployment rate in the county (3.9 – 16.8) County Hr Wage - average starting hourly manufacturing wage in the county Test - student score on college admission test (0 to 100 scale) Dist to college - Distance to near college (measured in 100’s of miles) Tuition - Tuition charged at nearest state university (measured in $1000s)…A rural state wants to encourage high school graduates to continue their education and attend college. The state collected information on a random sample of high school seniors from across the state 7 years ago and is now observing how many years of education they completed. They believe students decide to achieve more education when they are more capable, have easier access to college education, and the opportunity cost of attending are lower. To explore the factors that affect the years of education completed they have used multiple regression to estimate the years of completed education as a function of: Unemployment rate - the unemployment rate in the county (3.9 – 16.8) County Hr Wage - average starting hourly manufacturing wage in the county Test - student score on college admission test (0 to 100 scale) Dist to college - Distance to near college (measured in 100’s of miles) Tuition - Tuition charged at nearest state university (measured in $1000s)…A rural state wants to encourage high school graduates to continue their education and attend college. The state collected information on a random sample of high school seniors from across the state 7 years ago and is now observing how many years of education they completed. They believe students decide to achieve more education when they are more capable, have easier access to college education, and the opportunity cost of attending are lower. To explore the factors that affect the years of education completed they have used multiple regression to estimate the years of completed education as a function of: Unemployment rate - the unemployment rate in the county (3.9 – 16.8) County Hr Wage - average starting hourly manufacturing wage in the county Test - student score on college admission test (0 to 100 scale) Dist to college - Distance to near college (measured in 100’s of miles) Tuition - Tuition charged at nearest state university (measured in $1000s)…
- Suppose there is a significant correlation between variables. describe 2 instances in which it might be inappropriate to use the linear regression model for predictionA fast-food chain decided to carry out an experiment to assess the influence of advertising expenditure on sales. Different relative changes in advertising expenditure, compared to the previous year, were made in eight regions of the country, and resulting changes in sales levels were observed the accompanying table shows the results. Increase in advertising expenditure (%) 0 5 15 20 25 30 35 40 Increase in sales (%) 5 10 18 25 35 50 60 65 Determine the value of regressions coefficients and write down the simple linear regression model.my question is: when there is a best fit linear regression model for a Adidas set, and we wish to use it to make an estimation describe the difference between interpolation and extrapolation. Which between interpolation and extrapolation is more likely to give a more accurate estimation?
- The General Aviation Manufacturers Association has reported annual flying hours and fuel consumption for airplanes with a single, piston-driven engine as listedin file XR15057. Data are in millions of flying hours and millions of gallons of fuel, respectively. Determine the linear regression equation describing fuel consumption as a function of flying hours, then identify and interpret the slope, the coefficient of correlation, and the coefficient of determination. At the 0.05 level of significance, could the population slope and the population coefficient of correlation be zero? Determine the 95% confidence intervalfor the population slope.(you can see file XR15057 from photo)A researcher was investigating variables that might be associated with the academic performance of high school students. The data included the average Math SAS score of all high school seniors in the city that took the exam (labeled as the variable SAT-M), the average number of dollars per pupil spent on education by the city (labeled as the variable $Per Pupil), and the percentage of high school seniors in the city that took the exam (labeled as the variable %Taking). The researcher ran the following multiple linear regression model as SAT-M=Beta0 + Beta1($Per Pupil) + Beta2(%Taking). This model was fit to the data using the method of least-squares, results shown inside of table within photo. If we want to test using ANOVA F-test with hypotheses Ho: Beta1=Beta2=0 versus H1: at least one of the Beta is not 0, what would the value of our F-statistic mean?Jensen, Solberg, and Zorn investigated the relationship of insider ownership, debt, and dividend policies in companies. One of their findings was that firms with high insider ownership choose lower levels of both debt and dividends. Shown here is a sample of data of these three variables for 11 different industries. Use the data to develop the equation of the regression model to predict insider ownership by debt ratio and dividend payout. Comment on the regression coefficients.
