What is the null and alternative hypothesis? These can be in words and/or symbols ( PPT
What is the null and alternative hypothesis? These can be in words and/or symbols ( PPT

MATLAB: An Introduction with Applications
6th Edition
ISBN:9781119256830
Author:Amos Gilat
Publisher:Amos Gilat
Chapter1: Starting With Matlab
Section: Chapter Questions
Problem 1P

Related questions
Question
Questions #4, #5, & #6
![nt1] - IBM SPSS Statistics Viewer
Data
Transform
Insert
Format
Analyze Graphs Utilities
Extensions
Window
Help
Case Processing Summary
Cases
Valid
Missing
Total
re Dataset
Percent
Percent
Percent
e Processing
tors * Treatme
Square Tests
Visitors * Treatment
39
100.0%
0.0%
39
100.0%
mmetric Measu
Visitors * Treatment Crosstabulation
Treatment
1.00
2.00
3.00
Total
Visitors
1.00
Count
9
3
12
Expected Count
3.4
4.9
3.7
12.0
% within Visitors
75.0%
25.0%
0.0%
100.0%
% within Treatment
81.8%
18.8%
0.0%
30.8%
2.00
Count
1
12
14
Expected Count
3.9
5.7
4.3
14.0
% within Visitors
7.1%
85.7%
7.1%
100.0%
% within Treatment
9.1%
75.0%
8.3%
35.9%
3.00
Count
1
11
13
Expected Count
3.7
5.3
4.0
13.0
% within Visitors
7.7%
7.7%
84.6%
100.0%
% within Treatment
9.1%
6.3%
91.7%
33,3%
Total
Count
11
16
12
39
Expected Count
11.0
16.0
12.0
39.0
% within Visitors
28.2%
41.0%
30.8%
100.0%
% within Treatment
100.0%
100.0%
100.0%
100.0%
IBM SPSS Statistics Processor is ready](/v2/_next/image?url=https%3A%2F%2Fcontent.bartleby.com%2Fqna-images%2Fquestion%2F3e749db4-6de4-4d45-947d-3b01aa068974%2Fea19a813-3635-4b0e-b078-5aa84933b1a7%2Fn5an6vs_processed.jpeg&w=3840&q=75)
Transcribed Image Text:nt1] - IBM SPSS Statistics Viewer
Data
Transform
Insert
Format
Analyze Graphs Utilities
Extensions
Window
Help
Case Processing Summary
Cases
Valid
Missing
Total
re Dataset
Percent
Percent
Percent
e Processing
tors * Treatme
Square Tests
Visitors * Treatment
39
100.0%
0.0%
39
100.0%
mmetric Measu
Visitors * Treatment Crosstabulation
Treatment
1.00
2.00
3.00
Total
Visitors
1.00
Count
9
3
12
Expected Count
3.4
4.9
3.7
12.0
% within Visitors
75.0%
25.0%
0.0%
100.0%
% within Treatment
81.8%
18.8%
0.0%
30.8%
2.00
Count
1
12
14
Expected Count
3.9
5.7
4.3
14.0
% within Visitors
7.1%
85.7%
7.1%
100.0%
% within Treatment
9.1%
75.0%
8.3%
35.9%
3.00
Count
1
11
13
Expected Count
3.7
5.3
4.0
13.0
% within Visitors
7.7%
7.7%
84.6%
100.0%
% within Treatment
9.1%
6.3%
91.7%
33,3%
Total
Count
11
16
12
39
Expected Count
11.0
16.0
12.0
39.0
% within Visitors
28.2%
41.0%
30.8%
100.0%
% within Treatment
100.0%
100.0%
100.0%
100.0%
IBM SPSS Statistics Processor is ready
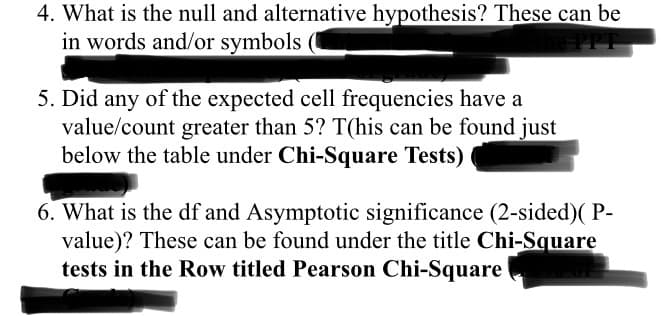
Transcribed Image Text:4. What is the null and alternative hypothesis? These can be
in words and/or symbols
5. Did any of the expected cell frequencies have a
value/count greater than 5? T(his can be found just
below the table under Chi-Square Tests)
6. What is the df and Asymptotic significance (2-sided)( P-
value)? These can be found under the title Chi-Square
tests in the Row titled Pearson Chi-Square
Expert Solution
This question has been solved!
Explore an expertly crafted, step-by-step solution for a thorough understanding of key concepts.

Step by step
Solved in 4 steps

Recommended textbooks for you
MATLAB: An Introduction with Applications
Statistics
ISBN:
9781119256830
Author:
Amos Gilat
Publisher:
John Wiley & Sons Inc

Probability and Statistics for Engineering and th…
Statistics
ISBN:
9781305251809
Author:
Jay L. Devore
Publisher:
Cengage Learning

Statistics for The Behavioral Sciences (MindTap C…
Statistics
ISBN:
9781305504912
Author:
Frederick J Gravetter, Larry B. Wallnau
Publisher:
Cengage Learning
MATLAB: An Introduction with Applications
Statistics
ISBN:
9781119256830
Author:
Amos Gilat
Publisher:
John Wiley & Sons Inc
Probability and Statistics for Engineering and th…
Statistics
ISBN:
9781305251809
Author:
Jay L. Devore
Publisher:
Cengage Learning
Statistics for The Behavioral Sciences (MindTap C…
Statistics
ISBN:
9781305504912
Author:
Frederick J Gravetter, Larry B. Wallnau
Publisher:
Cengage Learning

Elementary Statistics: Picturing the World (7th E…
Statistics
ISBN:
9780134683416
Author:
Ron Larson, Betsy Farber
Publisher:
PEARSON

The Basic Practice of Statistics
Statistics
ISBN:
9781319042578
Author:
David S. Moore, William I. Notz, Michael A. Fligner
Publisher:
W. H. Freeman

Introduction to the Practice of Statistics
Statistics
ISBN:
9781319013387
Author:
David S. Moore, George P. McCabe, Bruce A. Craig
Publisher:
W. H. Freeman