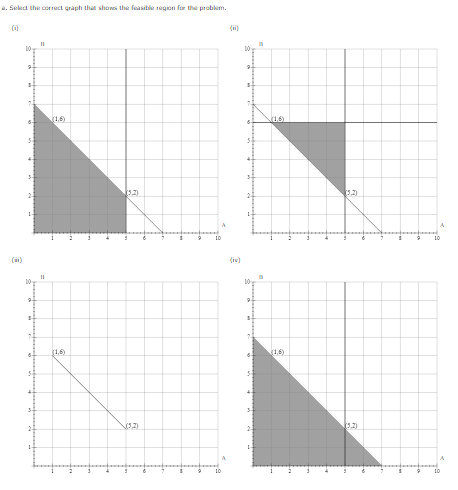
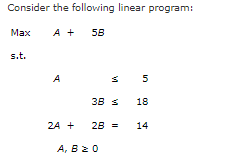
What is the orrect graph that shows the feasible region for the problem. b. What are the extreme points of the feasible region? c. What is the correct graph that shows the optimal solution for the problem


Q: Your organization is considering refurbishing your office building, as a facility manager, you have…
A: Sustainable development:- Maintaining the capacity of natural systems to continue delivering the…
Q: What are the unanticipated effects of these measures, which may have the unforeseen impact of…
A: The goal of the methods and concepts known as "lean manufacturing" is to reduce the amount of time…
Q: A catalog order-filling process can be described as follows:12 Telephone orders are taken over a…
A: Lean principles are described as the process through which transformation can be brought into the…
Q: Yawndai Motors Co. is planning to manufacture a new car model. The company would like to ensure that…
A:
Q: 1. How do you integrate online and social media touchpoints, customer information, and insights…
A: the steps to integrate online and social media touchpoints, customer information, and insights…
Q: vide to an organization's operations
A: Complex software is used to handle every aspect of the company, including supply chains, business…
Q: Describe the importance of control over inventory ?
A: NOTE: We are allowed to do the first question only. Inventory management is all about calculating…
Q: Solve the following LP Write the original optimal solution and objective function value. b) What…
A: Note: - As we can answer up to three subparts, we will answer the first three subparts here. If an…
Q: The diagram below shows a system that includes 7 operations with their capacities given as units/hr.…
A: The operational systems affect the business processes by providing the necessary resources. When the…
Q: .What is the objective function? 2. Express the first constraint (wood) in mathematical sentence 3.…
A: Linear programming is a mathematical technique that is also used in operations management…
Q: ... a. The profit using Operation 1 is $ 4,237 per day. (Round to the nearest dollar.) The profit…
A: Given:
Q: (1) The management of the bill of materials must be owned by the design team triggered by the…
A: 1) A bill of materials is a list of all the parts, ingredients, or materials required to assemble or…
Q: Business transactions taking place within geographical boundaries of a nation is known as
A: Internal commerce is the buying and selling of commodities and services within the borders of a…
Q: Why is a process exception necessary?
A: With the correct technology, the whole order lifecycle can be automated. When anything goes wrong…
Q: Take into account the traits that you believe make a project stand out.
A: Projects of a business are of core importance to its people working internally and associated…
Q: John and Mary work for a direct marketing firm. They make calls to customers for a local carpet…
A: The productivity of an employee within the context of operations management highlights the amount of…
Q: a) The time Determine and also estimate: Activity A estimates. the find expected to 10 which of…
A:
Q: Optimization Problem: Emesto is to plant a garden with two types of tree: palms and conifers. He is…
A: Le number of palms be x and the number of conifers is y.
Q: ssuming fixed costs for Fat-Free brownies are $350, how many of this new product will they have to…
A: Given:
Q: Minimize Z = 3x₁ + 2x₂ + 7x3, subject to -x₁ + x₂ = 10 2x₁ - x₂ + x3 ≥ 10 x2 and X₁ ≥ 0, X₂ ≥ 0, x3…
A: Linear programming is a mathematical technique that is also used in operations management…
Q: gift-wrapping business is staffed by Kaitlyn, Rob, Sam, Susan and Sarah. The production by each of…
A: Given, 8 hour work day = 480 minutes Jared production = 64 packages 1. Productivity =…
Q: The Decision Variables in a What If analysis provide the limitations for each variable. O True O…
A: A what-if analysis is a simulation technique that is often used in business and engineering.
Q: Up, Up, and Away is a producer of kites and wind socks. Relevant data on the bottleneck operation in…
A: Given data; No. of shifts 2 shifts Given table; No. of hrs per shift 8…
Q: Briefly argue the need and relevance of a project quality plan, then state and justify at least…
A: Seeing to it that a project is completed on time and within its allotted budget is not quality. It's…
Q: esults in 100 – 99 = 1 foot of trim loss). Orders in hand for the coming week are 5,670 12-foot…
A: Given data is Pattern 12-ft 15-ft 30-ft Trim loss(ft) 1 0 6 0 10 2 0 0 3 10 3 8 0 0 4 4 2…
Q: A craftsman named William Barnes builds two kinds of birdhouses, one for wrens and a second for…
A: Graphical Method: In order to find the optimal answer to a mathematical model, a procedure known as…
Q: If the mean = 20.3834 standard deviation = 101.53 What is the probability that daily demand will…
A: Given data: Mean (μ) = 20.3834 Standard deviation (σ) = 101.53
Q: The Canine Gourmet Company produces delicious dog treats for canines with discriminating tastes.…
A: The x-bar and r-bar control charts are two types of control charts that can be used to monitor the…
Q: Analyse the eight elements of total quality management and determine which you believe are present…
A: 8 elements of total Quality management: Total quality management is a management…
Q: Please advise whether the below topic can be use for DBA ( Doctorate of Business Administration)…
A: A Doctorate of Business Administration is a type of professional degree designed for individuals who…
Q: 9.4 A florist carries an average inventory of $12,000 in cut flowers. The flowers require special…
A: A firm's numerous expenses for keeping goods on hand are known as carrying costs. Taxes, insurance,…
Q: Defect A B C D E Defect Description Poorly Covered Etiqueta corrida Volume out of specifications…
A:
Q: What are the three most crucial factors to bear in mind when buying new hardware?
A: When choosing computer hardware and software, the following three things should be taken into…
Q: weeks. (Round your response to two decimal places.) weeks. (Round your response to two decimal…
A: The critical path method (CPM) is a project management technique that identifies the sequence of…
Q: You have been given sales data for TOMMY's Fall/Winter/Spring/Fall New Collection for the last 4…
A: Forecasting is a technique used to predict future outcomes on the basis of past data. In business…
Q: The following data relate the sales figures of the bar in Mark Kaltenbach's small bed-and-breakfast…
A: Regression analysis the estimate the relationship between a dependent variable and one independent…
Q: Logistics Management Information Systems are usually complex. Making changes to a system without…
A: Logistics management refers to the management of the transportation of goods. It will include…
Q: Max Z= 6x, + 8x₂ s.t. 2X₁ X₂ ≤ 50 3x₂ +4x₂ < 180 - X₁ +2x₂ ≤ 40 X₁, X₂ ≥ 0
A: As per Bartleby guidelines, we can only solve one question at a time...Kindly upload the other…
Q: Give an example of an IT project.
A: Information technology project management is the process of planning, scheduling, monitoring and…
Q: In Myanmar (formerly Burma), six laborers, each making the equivalent of $5.00 per day, can produce…
A: Labour cost is an essential part of the project. It refers to the price which orders to get the…
Q: Suppose the monthly demand for automobile tires at a tire dealer is Normally distributed with a mean…
A: Ans) z value for 95% = invNorm(0.95)= 1.6449 Formula : Z = X - Mean / Standard Deviation 1.6449=…
Q: 4.8 We Rescue, Inc., a firm providing nationwide ambulance services, intends to expand its service…
A:
Q: Which statement is true? A. In the Service (Productt) Processs matrix, the degree of labor…
A: Service process matrix can be defined as a classification matrix of the service industry firms based…
Q: 1. Convert the Activity on Node diagram to an Activity on Arrow diagram
A: As per Bartleby guidelines, we can only solve one question at a time...Kindly upload the other…
Q: Romans Food Market, located in Saratoga, New York, carries a variety of specialty foods from around…
A: BR = pound of Brazilian bean purchased to produce Regular BD = pound of Brazilian bean purchased…
Q: Jse the Big M method, work through the simplex method step by step to demonstrate that the problem…
A: Linear programming is a mathematical technique that is also used in operations management…
Q: Prepare the scatter diagram and insert the trendline or line of best-fit. Use a scale of 2 cm to…
A: The scatter diagram is a graphical representation of the relationship between two variables. A…
Q: How does a systems selection report function and what is it?
A: A system selection report is a graphical visualization that helps the organization choose the best…
Q: Given the following data, use least-squares regression to derive a trend equation: Period Demand…
A: Linear Regression Assume X = Period Y = Demand X Y XY X2…
Q: F 16. A company must produce 100,000 units of a new product over the course of a year. Starting…
A: Given data: Annual Demand (D) = 100,000 units Holding Cost (H) = $5 per unit per year Setup Cost…
a. What is the orrect graph that shows the feasible region for the problem.
b. What are the extreme points of the feasible region?
c. What is the correct graph that shows the optimal solution for the problem

Step by step
Solved in 4 steps with 3 images

- Consider the following LP problem developed at Zafar Malik's Carbondale, Illinois, optical scanning firm: Maximize Z= 1X1+1X2 Subject to: 2X1+1X2≤72 (C1) 1X1+2X2≤72 (C2) X1,X2≥0Consider the following LP problem developed at Zafar Malik's Carbondale, Illinois, optical scanning firm: Maximize Z= 1X1+1X2 Subject to: 2X1+1X2≤100 (C1) 1X1+2X2≤100 (C2) X1,X2≥0 Part 2 The optimum solution is: Part 3 X1= ______ (round your response to two decimal places).For the products A, B, C, and D, which of the following could be a linear programming objective function? Select one: a. Z = 1A + 2BC + 3D b. Z = 1A + 2AB + 3ABC + 4ABCD c. Z = 1A + 2B + 3C + 4D d. Z = 1A + 2B/C + 3D
- Vladimir Ulanowsky is playing Keith Smithson in atwo-game chess match. Winning a game scores 1 match 19.4 Further Examples of Probabilistic Dynamic Programming Formulations 1029 point, and drawing a game scores 12match point. After thetwo games are played, the player with more match points isdeclared the champion. If the two players are tied after twogames, they continue playing until someone wins a game(the winner of that game will be the champion). Duringeach game, Ulanowsky can play one of two ways: boldly orconservatively. If he plays boldly, he has a 45% chance ofwinning the game and a 55% chance of losing the game. Ifhe plays conservatively, he has a 90% chance of drawing thegame and a 10% chance of losing the game. Ulanowsky’sgoal is to maximize his probability of winning the match.Use dynamic programming to help him accomplish thisgoal. If this problem is solved correctly, even thoughUlanowsky is the inferior player, his chance of winning the match is over 12. Explain this…Consider the following LP:Maximize z = 16x1 + 15x2subject to40x1 + 31x2 <=124-x1 + x2<= 1x1<=3x1, x2 >= 0(a) Solve the problem by the simplex method, where the entering variable is thenonbasic variable with the most negative z-row coefficient.Find the values of x1 and x2 where the following two constraints intersect. (Round your answers to 3 decimal places.) (1) 10x1 + 5x2 ≥ 50 (2) 1x1 + 2x2 ≥ 12
- Given four decision variables A, B, C, and D, which of the following could be a linear programming problem constraint? 1A + 2B - 1C/D >=23 1A + 2A*B + 3A*B/C + 4A*B*C*D >=100 1A + 2B + 3C + 4D >=100 1A + 2B/C + 3D <=45 1A + 2B*C + 3D <=100The second-largest public utility in the nation is the sole provider of elasticity in 32 counties of southern Florida. To meet the monthly demand for electricity in these counties, which is given by the inverse demand function P = 1,200 – 4Q, the utility company has set two electric generating facilities: Q1 kilowatts are produced at facility 1 and Q2 kilowatts are produced at facility 2 (so Q = Q1 + Q2). The costs of producing electricity at each facility are given by C1(Q1) = 8,000 + 6Q12 and C2(Q2) = 6,000 + 3Q22 , respectively. Determine the profit-maximizing amounts of electricity to produce at the two facilities, the optimal price, and the utility company’s profits.Which of the following is the optimal value of the objective function for the LP model in this problem? Minimize z=4x + 8y Subject to: x+1.6y>=45 2x+0.5y>=40 X+y<=40 XY>=0 a.220 b.160 c.240 d.200
- Set up the simplex matrix used to solve the linear programming problem. Assume all variables are nonnegative. Maximize f = 8x + 9y + 3z subject to 2x + 7y + 8z ≤ 100 6x + 3y + z ≤ 160 3x + 4y + 9z ≤ 10 .A market analyst working for a small appliance manufacturer finds that if the firm produces and sells x blenders annually, a model for the total profit (in dollars) is P(x) = 8x + 0.3x2 − 0.001x3 − 372. Graph the function P in an appropriate viewing rectangle, and use the graph to answer the following questions. (a) When just a few blenders are manufactured, the firm loses money (profit is negative). (For example, P(10) = −263, so the firm loses $263.00 if it produces and sells only 10 blenders.) How many blenders must the firm produce to break even? (Round your answer to the nearest whole number.) blenders(b) Does profit increase indefinitely as more blenders are produced and sold? YesNo If not, what is the largest possible profit the firm could have? (If profit increases indefinitely, enter your answer as ∞. Otherwise, round your answer to the nearest cent.)We have 60 meters of fence and want to fence a triangular shaped area. Please formulate an NLP (do not try to solve) that will enable us to maximize the fenced area (Hint: The area of a triangle with sides of length a, b, and c is ( s (s – a) (s – b) (s – c))1/2, where s is half the parameter of the triangle).