What is the point estimate of the annual income of a salesperson with three years of college? Test whether the number of years in college has a significant impact on income at α= .05. What are the hypotheses? How do you test the hypotheses? What is the conclusion? What is the value of the correlation coefficient between dependent variable and independent variable? What is the implication of the correlation coefficient? What is the R Square of this model? What does it mean? Use the information in ANOVA table to calculate R square.
What is the point estimate of the annual income of a salesperson with three years of college? Test whether the number of years in college has a significant impact on income at α= .05. What are the hypotheses? How do you test the hypotheses? What is the conclusion? What is the value of the correlation coefficient between dependent variable and independent variable? What is the implication of the correlation coefficient? What is the R Square of this model? What does it mean? Use the information in ANOVA table to calculate R square.

Big Ideas Math A Bridge To Success Algebra 1: Student Edition 2015
1st Edition
ISBN:9781680331141
Author:HOUGHTON MIFFLIN HARCOURT
Publisher:HOUGHTON MIFFLIN HARCOURT
Chapter11: Data Analysis And Displays
Section11.4: Two-ways Tables
Problem 12E

Related questions
Question
What is the point estimate of the annual income of a salesperson with three years of college?
Test whether the number of years in college has a significant impact on income at α= .05. What are the hypotheses? How do you test the hypotheses? What is the conclusion?
What is the value of the
What is the R Square of this model? What does it mean? Use the information in ANOVA table to calculate R square.
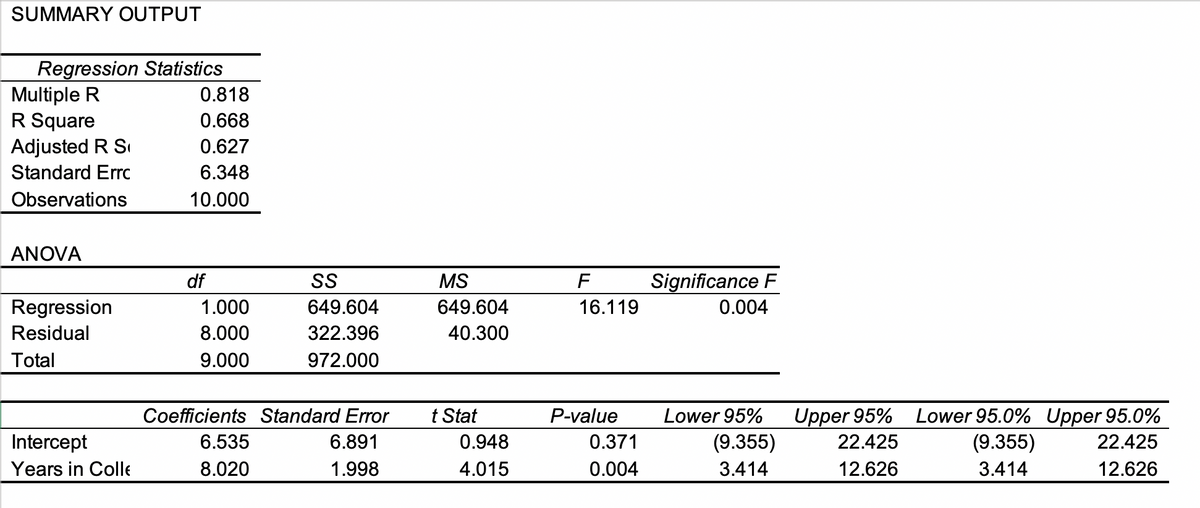
Transcribed Image Text:SUMMARY OUTPUT
Regression Statistics
Multiple R
R Square
Adjusted R S
Standard Errc
0.818
0.668
0.627
6.348
Observations
10.000
ANOVA
Significance F
0.004
df
S
MS
F
Regression
1.000
649.604
649.604
16.119
Residual
8.000
322.396
40.300
Total
9.000
972.000
Coefficients Standard Error
t Stat
P-value
Lower 95%
Lower 95.0% Upper 95.0%
(9.355)
Upper 95%
Intercept
6.535
6.891
0.948
0.371
(9.355)
22.425
22.425
Years in Colle
8.020
1.998
4.015
0.004
3.414
12.626
3.414
12.626
Expert Solution
This question has been solved!
Explore an expertly crafted, step-by-step solution for a thorough understanding of key concepts.

Step by step
Solved in 3 steps

Knowledge Booster


Learn more about
Need a deep-dive on the concept behind this application? Look no further. Learn more about this topic, statistics and related others by exploring similar questions and additional content below.Recommended textbooks for you
Big Ideas Math A Bridge To Success Algebra 1: Stu…
Algebra
ISBN:
9781680331141
Author:
HOUGHTON MIFFLIN HARCOURT
Publisher:
Houghton Mifflin Harcourt

Algebra & Trigonometry with Analytic Geometry
Algebra
ISBN:
9781133382119
Author:
Swokowski
Publisher:
Cengage

Linear Algebra: A Modern Introduction
Algebra
ISBN:
9781285463247
Author:
David Poole
Publisher:
Cengage Learning
Big Ideas Math A Bridge To Success Algebra 1: Stu…
Algebra
ISBN:
9781680331141
Author:
HOUGHTON MIFFLIN HARCOURT
Publisher:
Houghton Mifflin Harcourt
Algebra & Trigonometry with Analytic Geometry
Algebra
ISBN:
9781133382119
Author:
Swokowski
Publisher:
Cengage
Linear Algebra: A Modern Introduction
Algebra
ISBN:
9781285463247
Author:
David Poole
Publisher:
Cengage Learning