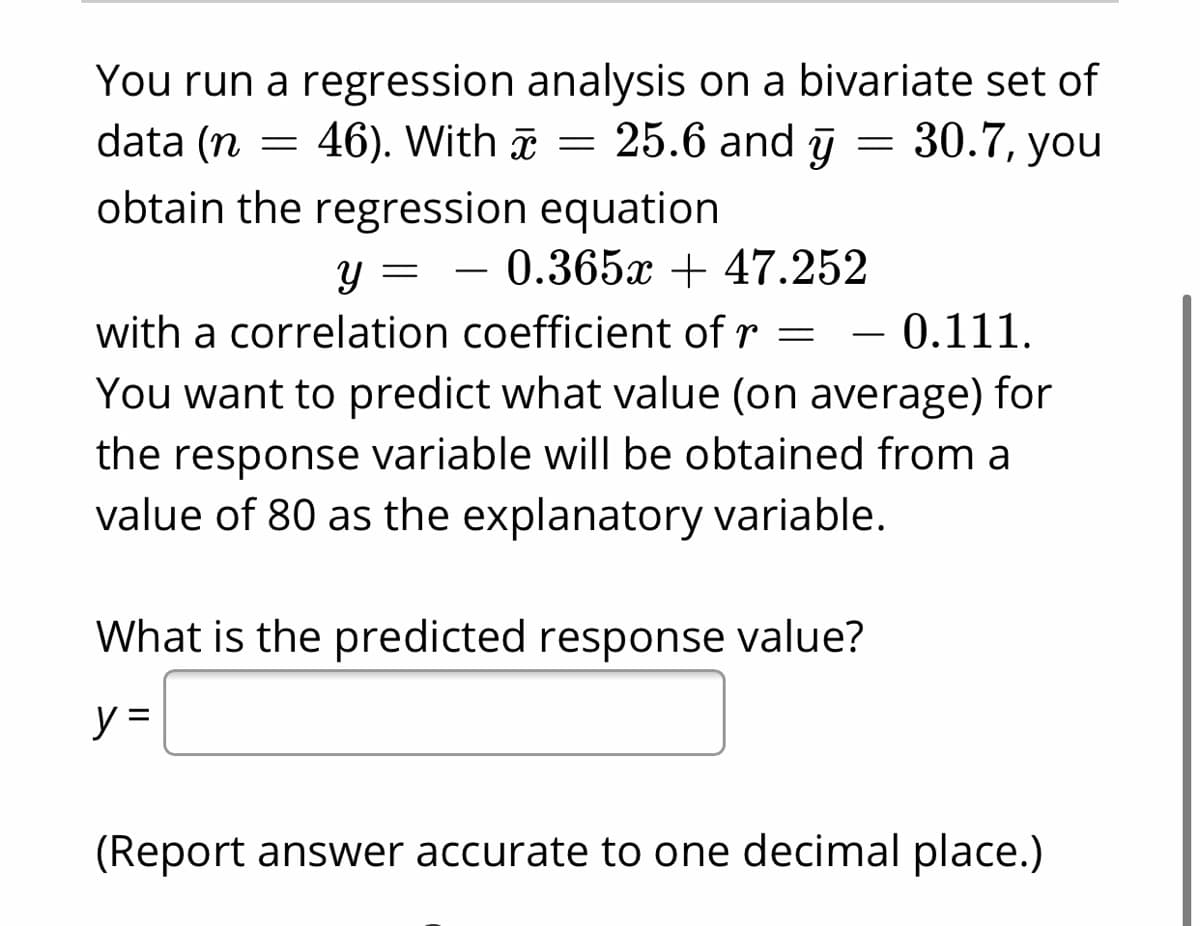
What is the predicted response value? y =


Q: What are the explanatory variable and response variable for this relationship?
A: Given that among a group of 138 customers aged 14-23 who send more text messages tend to use a…
Q: What are Z scores?
A:
Q: The yiceld of corn in bushels per acre and the amount of rain in the growing season Identify the…
A: Explanatory variable is the variable which explain or cause effect in response variable. Response…
Q: Why is the response rate an important consideration in survey? And give some examples to…
A: If response rate is low, results may notdemonstrate the population as well as if response rate was…
Q: A medical journal reported on an experiment intended to see if a certain drug could be used as a…
A: Since you have posted a question with multiple sub-parts, we will solve the first 3 sub-parts for…
Q: The test statistic is:
A: 19. Here , we want to find the value of test statistic. Here we use the paired t-test. As per our…
Q: What are the values of the test statistic and P-value for their test?
A: We have to conduct a Chi - square test of independence.
Q: What are the treatments and the response variables ?
A: From the given information, we are concerned about the effects of texting on driving performance We…
Q: k of developing lung cancer among individuals who smoke is 15.0. Which of the following is the most…
A: Relative risk is the ratio of the risk exposure group to the risk of non-exposure group. It is one…
Q: Suppose we want to use systolic blood pressure to predict diastolic blood pressure. The explanatory…
A: Solution
Q: What is the moment generating function of the sample mean?
A: Mgf (i)Sample mean=x⏞=Σxin=x1+x2+..+xn10…
Q: When do you use the t-statistic and what is the advantage over the z-statistic?
A: Conditions for using t statistic: The t statistic is used in the hypothesis testing, for testing the…
Q: What is formula for degree of freedom?
A: Degrees of freedom in statistics are the number of independent observation or variables that can…
Q: What is the value of the test statistic, F?
A:
Q: Stacy conducts a study to look at the effects of season (fall, winter, spring, summer) and type of…
A: Two way ANOVA: From the given information, the data view of the given variables is, fall…
Q: Is “how long it takes to correctly solve the puzzle” an explanatory variable or response variable?…
A: The variable that explains the expected cause, i.e., in other words, the variable that explains the…
Q: how do i find quartile 1 in a set of data?
A: First quartile: The first quartile is the middle-most observation or median of the lower half of the…
Q: Explain the concept of standardize the predictor variable ?
A: Standardization is the process of putting different variables on the same scale. The standardization…
Q: Does a prep course increase SAT scores? Last year, a school offered an after-school SAT prep class…
A: Note: Hey there! Thank you for the question. As you have posted multiple sub-parts, according to our…
Q: What is the predicted response value?
A: Given: x y 67.7 -25.7 72.2 -5 55.8 21.3 64.1 11 70.9 64.9 61.6 -25 65.3 84.6…
Q: What is the expected value and variance of flight time?
A: Given that x~u (120 ,140 ) Find Expected value =? Variance =?
Q: What is the explanatory variable ?
A: What is the explanatory variable ?
Q: THE IMPACT OF DRINKING COFFEE FOR ACADEMIC PERFORMANCES OF THE PARTICIPANTS
A: Given information: The data represents the values of the variables x = Number of cups and y =…
Q: What does the term expected cell frequencies refer to?
A: question:
Q: How do you calculate the p-value given the correlation coefficiet (R) and the sample (n)?
A: We have to calculate p value if correlation coefficient (R) and sample size (n) is given We can…
Q: s the significant difference?
A: Hypothesis: Null Hypothesis: The factor affecting the career choice of the students is their…
Q: What is the 40th percentile of wait times for customers calling the help line?
A: Here given Amount of time customer wait is exponentially distributed with mean 7.5 minutes
Q: How does having leather seats affect the expected price of the car, controlling for the mileage and…
A: Let us construct the regression equation by using the coefficient. price = 6953 - 0.0841*Mileage +…
Q: What are characteristics of a t test?
A: T-test: The t-test is used to check the significant difference between the two groups. By comparing…
Q: What is the predicted explanatory value? X =
A: The regression equation is y=-3.546x-4.393.
Q: The expected relative frequency of a particular outcome is?
A: The relative frequency is the ratio of the number of times a particular value of the data occurs to…
Q: You are planning a cross-sectional study of the impact of chocolate milk shake drinking on obesity…
A: Sensitivity and Specificity: While measuring the effect of any given factor on a particular disease,…
Q: Are the observed frequencies variables? What about the expected frequencies? Explain your answers.
A: Chi-square Distribution: If X ~ N(0,1) then X2 is known as chi-square variate. If X ~ N(µ,σ2) then z…
Q: What is the test statistic? What is the p value?
A: We have given that Population proportion, p = 0.785 Sample proportion, p^ = 0.36 Sample size = 853
Q: Rebecca is investigating if height has any effect on red blood cell count. What is the response…
A:
Q: The number of text messages sent and the number of phone calls made in a sample of 100 students…
A:
Q: A measure of total variation in the observed values of the response variable is the ______. The…
A: Coefficient of determination: The coefficient of determination (R) is the percentage of the total…
Q: do I find the standardized z-score?
A: A z-score gives you an idea of how far from the mean a data point is.
Q: What does a statistically significant t test indicates?
A: Statistical significance: In the study, when the result obtained is very unlikely to occur just by…
Q: How many independent variables are being tested in this study? 01
A: Given : We have given that design matrix , Level of anxiety…
Q: B. Would the Floor Area be a significant predictor of Assessed Value?
A: Let x be the floor area, and y be the assessed value.
Q: What is the response variable? Is it categorical or quantitative ?
A: It is an important part of statistics. It is widely used.
Q: What are the explanatory and response variables?
A: Response variable is defined as the variable which depends on other variable i.e changes on changing…
Q: 2. Suppose you want to test the factors that potentially affect the germination of bean. | (a) What…
A: Given Information: The objective of this experiment is to investigate the factors that affect the…
Q: What is the difference from a controlled variable and the control in a scientific experiment?
A: A control variable is any factor that we control or hold constant during an experiment. Whereas…
Q: The difference between an observed value and a predicted value of the response variable is called a…
A: Residual: The difference between the observed value of the response variable and actual value of the…
Q: What does a negative z score mean?
A: In this question we have to tell what does the negative Z score implies. A Z Score means that how…


Trending now
This is a popular solution!

Step by step
Solved in 2 steps with 2 images


- The average midterm score in a large statistics class was 70 with an SD of 10. The average final score in the same class was 65 with an SD of 15. The correlation coefficient between midterm and final scores was r=0.6. Using the regression line, we predict the final score of a student with a midterm score of 60 to be , but this prediction is likely to be off by about . Fill in the blanks, rounding each answer to one decimal point.After performing a statistical regression on a set of data the value of the correlation coefficient r was -0.2041. What does that imply about the data?Jimmy tested a sample with of n=4 pairs of X and Y scores and found SSY = 48 and a Pearson correlation between X and Y of r = 0.4 Calculate whether the Fobserved in this regression experiment is significant at the ∞ = o.01 level
- In a study of possible correlation between the height in cm (X) and the weight in kg (Y) of chimpanzees, a sample of 40 animals produces a correlation coefficient of r=0.813 and a regression line with equation Y=0.34X+19.5. What is the expected weight of a chimpanzee that is 157 cm tall? Round off final answer to 2 decimal places.If a sample of 25 pairs of data yields a correlation coefficient, r, of 0.390 and the scatterplot displays a linear trend, can you use the regression equation to make predictions, assuming your x-values are within the domain of the data set? Choose your answer from the multiple choice answers below A.) Yes, because rcrit = 0.396 and the regression coefficient, r, is less than this value. B.) Yes, because rcrit = 0.381 and the regression coefficient, r, is greater than this value. C.) No, because rcrit = 0.381 and the regression coefficient, r, is greater than this value. D.) No, because rcrit = 0.396 and the regression coefficient, r, is less than this value.I see that you ran a correlation for Pearson's r, can you run a linear regression?
- You are testing the null hypothesis that there is no linear relationship between two variables, X and Y. From your sample of n=18,you determine that b1=4.6 and Sb1=1.9. a. What is the value of tSTAT? b. At the α=0.05 level of significance, what are the critical values?If other factors are held constant and the Pearson correlation value between X and Y is r = 0.80, then the regression equation will tend to produce more accurate predictions than would be obtained if the Pearson correlation value was r = 0.60. True or FalseIf the R-squared for a regression model relating the outcome y to an explanatory variable x is 0.9. This implies that y and x are positively correlated.
- If other factors are held constant and the Pearson correlation value between X and Y is r = 0.80, then the regression equation will tend to produce more accurate predictions than would be obtained if the Pearson correlation value was r = 0.60. Group of answer choices True FalseYou run a regression analysis on a bivariate set of data (n=54n=54). With ¯x=35.7x¯=35.7 and ¯y=30.3y¯=30.3, you obtain the regression equation y=3.958x−111.001 y=3.958x-111.001 with a correlation coefficient of r=0.379 r=0.379. You want to predict what value (on average) for the response variable will be obtained from a value of x=190x=190 as the explanatory variable. What is the predicted response value?A study was done to determine the relationship between the alcohol content of beer, and the amount of calories in a 12 oz serving size. The sample data is provided in the data below. a) From this sample data, can you conclude (at the alpha=0.05 level) that there is in fact a linear correlation between the two variables? Use the statistics (correlation coefficient, value) to describe the correlation (if any). B) Using the sample data, find a regression equation to estimate the number of calories in a beer. C) Dogfish Head Brewery in Milton, Delaware has an I.P.A. beer called "120 minute IPA" which has an alcohol content of 18%. Using your regression equation, estimate the number of calories in a 12 oz serving of 120 Minute. Brand/Beer Alcohol Content (%) Calories (per 12 oz) Big Sky Scape Goat Pale Ale 4.70 163 Sierra Nevada Harvest Ale 6.70 215 Steel Reserve 8.10 222 Coors Light 4.15 104 Genesee Cream Ale 5.10 162 Sierra Nevada Summeefest Beer 5.00 158 Michelob Beer…