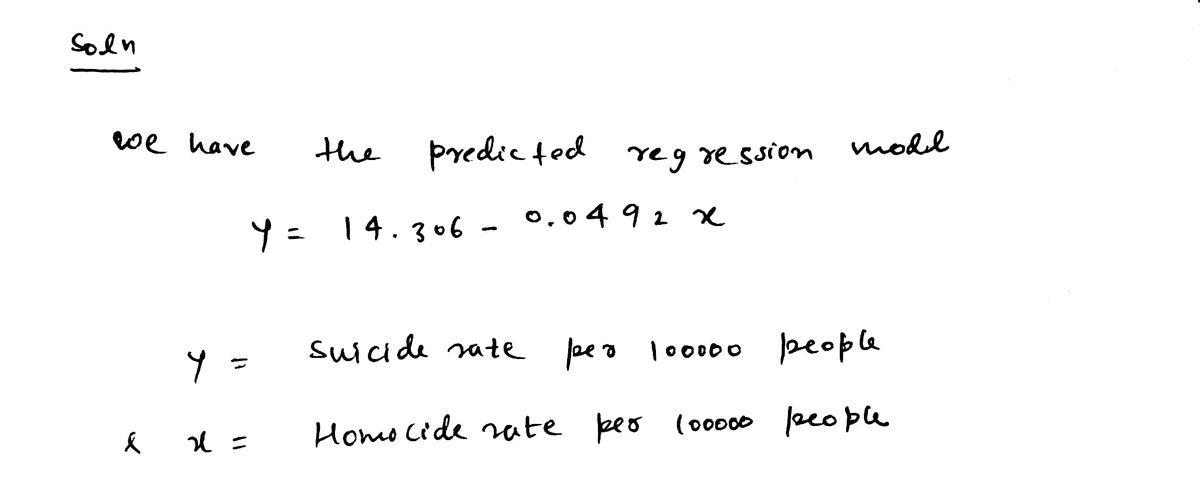
What is the predicted suicide rate per 100000 people ?


Q: Sample size for an interval estimate of a population proportion Suppose academic researchers are…
A: Given,margin of error(E)=0.1sample proportion(p^)=0.4
Q: 1) (9.1) A study was conducted asking adult American workers, "Do you currently have less than…
A: Given that: Count of successes, x=496 Total number of respondents in the study or sample size,…
Q: Find the range and sample standard deviation of the data: (Round the answer to 2 decimal places) 11…
A:
Q: Let X and Y be discrete random variables with joint probability function - for x = 0, 1, ..., 5 and…
A: Let X and Y be the discrete random variable with joint probability function is, P(x,y)=121 ; For…
Q: Do beavers benefit beetles? Researchers laid out 2323 circular plots, each 44 meters in diameter, in…
A: Given data: Stumps Beetle larvae 22 1010 22 3030 11 1212 33 2424 33 3636 44 4040…
Q: You may need to use the appropriate technology to answer this question. Consider the data. 12 20 14…
A: The data shows x and y variables.
Q: Enter the equation of the least‑squares regression line, with the numerical values rounded to three…
A: The given data is as follows. Brother Sister 71 69 68 64 66 65 67 63 70 65 71 62 70…
Q: In this box plot from Ch03, the box's height represents the and the vertical lines coming out of the…
A: The question is about graphical representation Introduction : Boxplot : 1 ) It is a graphical data…
Q: 2. Tree diagrams a) Draw a tree diagram to illustrate the possible outcomes of tossing a coin and…
A: Here we have to draw a tree diagram when toss a coin and rolling a six-sided die
Q: The average starting salary for this year's graduates at a large university (LU) is $20,000 witha…
A: For the distribution of the starting salary (in thousand dollars) which is distributed normally, it…
Q: For Monday through Thursday when there isn’t a holiday, the average number of vehicles that visit a…
A:
Q: Stenographer’s typos. A very skilled court stenographer makes one typographical error (typo) per…
A: a) Suppose a random variable x defines the number of typographical error (typo) made by a very…
Q: 5. The interest rates on 30-year mortgages offered by 150 randomly selected banks in NCR are…
A: Given data: Mortages Rate Frequency 12.51-14.50 12 14.51-16.50 8 16.51-18.50 36…
Q: Question: Given a normal distribution with mean 100 and standard deviation 15, what is the…
A: The probability of randomly selecting a value greater than 130 is given by
Q: 4. A medium-sized company characterized their employees based on the sex of the employee and their…
A: “Since you have posted multiple questions with multiple sub parts, we will provide the solution only…
Q: Mario's weekly poker winnings have a mean of 323 dollars and a standard deviation of 50 dollars.…
A: Suppose the random variable x defines the weekly poker winning amount.
Q: Given two independent samples, with sample sizes n1 = 35 and n2 = 30 and their respective sample…
A: Given The data is as follows: Sample sizes n1=35 and n2=30 Sample means x¯1=20 and x¯2=22 Standard…
Q: In a factory, 40% of the machines are defective. If a sample of 10 machines is selected randomly,…
A: Calculate the number of possible combinations of 4 defective machines out of 10: (10 choose 4) =…
Q: DATAfile: Sales You may need to use the appropriate appendix table or technology answer this…
A:
Q: In the following sample Excel sheet, enter the value of the mean in cell C3 (rounded to five decimal…
A: The sample size is 5, sum is 0.0047 and standard error is 0.00441153.
Q: (d) Identify the factor levels. (e) Identify the treatments. (f) Identify the experimental units and…
A: Given: 100 pizzas are randomly assigned to 5 different temperatures and baked for 15 minutes. 20…
Q: 6) The accompany box-and-whisker plot summarizes test scores on a math test taken by 24 students LV…
A: From box plot, Minimum value=42 Q1= first Quartile=52 Median= Second Quartile=73 Q3= third…
Q: An urn contains 22 marbles consisting of 10 red marbles, 7 blue marbles, and 5 yellow marbles. What…
A: Given:An urn contains 22 marbles consisting of 10 red marbles, 7 blue marbles, and 5 yellow marbles.…
Q: D4.5.9. What statistic would you use if you had three normally distributed (scale) independent…
A: F-test is used to test the overall significance of the model. The model to show the relationship…
Q: The heights of adult men in America are normally distributed, with a mean of 69.4 inches and a…
A: Given data normal distributionmen : μ1 = 69.4σ1 = 2.68women : μ2= 64.3σ2 = 2.55
Q: events and F(A), 1 (D), and Patients arriving at a hospital outpatient clinic can select one of…
A: Given Information: Patients arriving at a clinic can select one of the three stations. Physicians…
Q: 2. Are rent rates influenced by the student population in a college town? Let rent be the average…
A: Given information: The model to test for a relationship is,…
Q: Z Score is -3.1 μ is 65 o IS 13, find x
A: From the provided information, Mean (µ) = 65 Standard deviation (σ) = 13 And z score = -3.1
Q: Suppose that a sample has been drawn from a normal population to conduct the hypothesis test Ho: ²…
A: Given,sample variance(s2)=68sample size(n)=24H0:σ2=40H1:σ2>40and α=0.04
Q: Calculate the range for each of the following data sets: a.…
A: Given: the set of data. a)22,−50,35,10,3,13,−2,1,24,22,−50,35,10,3,13,-2,1,24…
Q: 72.5% of the students at Sarasota Community College are from in-state. If 27,950 students are from…
A: From the provided information, 72.5% of the students at Sarasota Community College are from in-state…
Q: For each description of data, identify theW’s, name the variables, specify for each variable whether…
A: Data may be roughly divided into two categories: qualitative or categorical and quantitative or…
Q: If the percentage of scores falling between the mean and a z score of +0.50 is 19.15%, then what is…
A: Given: The percentage of scores falling between the mean and a z score of +0.50 is 19.15%.
Q: he... MINDTAP b Sear.... C Ap ng.cengage.com BA2... increasing Mind Ta..... Hide Feedback b Suc.....…
A:
Q: Of a random sample of 1,200 people in Country A, 720 had a positive attitude toward car salespeople.…
A: State the null and alternative hypotheses. From the information, the claim of the test is that a…
Q: What is a point estimate in a confidnece interval for a t test?
A: According to the given information in this question We need to identify what is point estimate in…
Q: I can't get "b" a and c are correct Three separate random samples of students (one…
A: In the test of hypothesis, the margin of error is a central concept . It is used to measure the…
Q: Calculate the 70th percentile of the data shown 2.7 4 4.5 5.5 7 9.4 11.3 11.6 13 13.1 13.3 13.5 15.3…
A: Given data: 2.7, 4, 4.5, 5.5, 7, 9.4, 11.3, 11.6, 13, 13.1, 13.3, 13.5, 15.3, 15.5, 16.2, 18.8,…
Q: Use the given categorical data to construct the relative frequency distribution. Natural births…
A:
Q: Please answer no. 2 only, asap please! DONT USE EXCEL
A: 2. Given The data is as follows: μ=5x¯=5.3σ=0.2n=30α=0.05 The test is right-tailed.
Q: O p= 1500 X = 1475, 6= 60. Confidence in terval d. 2 comp. b. Lent c. decision n= 35 95% two-tailed
A: “Since you have asked multiple questions, we will solve the first question for you. If you want any…
Q: Preventing suicide is a important issue facing mental health workers. Predicting geographic regions…
A: The given data is as follows. Homicide Rate Suicide rate 4.0 11.2 10.8 15.3 12.2 11.4…
Q: Suppose you buy a new car whose advertised mileage is 20 miles per gallon (mpg). After driving your…
A: Given,mean(μ)=20standard deviation(σ)=1.02
Q: The vending machine problem Have you ever purchased a hot drink from a vend- ing machine? The…
A: This report is written to provide recommendations to the vending machine company president on the…
Q: The following table classifies 100 individuals using two variables, gender and college attended.…
A: Given that College Attended None Two-year Four-year Total Gender Male 7 13 30 50 Female 13 17 20 50…
Q: Question: How is the confidence interval for the difference between the means of two independent…
A: Introduction The confidence interval is a measure of the range of values that is likely to contain…
Q: The given figure displays the relationship between golfers' scores on the first and second rounds of…
A: The correlation measures the relationship between the two variables. It is the statistical…
Q: 1. Suppose you have a simple linear regression model with 51 observations. (a) You know that the…
A: In bi-variate data (x,y) where x is the independent variable and y is the dependent variable, one…
Q: The heights of adult men in America are normally distributed, with a mean of 69.4 inches and a…
A: given data, normal distributionadult men :μ=69.4σ=2.68adult women :μ=64.3σ=2.55we have to find out…
Q: What are example situation/s that will show the concept of probability distribution, normal…
A: Introduction The probability shows how likely an event occurs.
What is the predicted suicide rate per 100000 people ?

Step by step
Solved in 2 steps with 2 images

