What is the Prediction Interval (1 decimal)? Lower value: Upper value: The Confidence Interval will be __________ (wider or narrower) than the Prediction Interval. Which interval is the appropriate one to use when estimating the average starting salary for students with a 6.8 GPA? Confidence Interval Prediction Interval
What is the Prediction Interval (1 decimal)? Lower value: Upper value: The Confidence Interval will be __________ (wider or narrower) than the Prediction Interval. Which interval is the appropriate one to use when estimating the average starting salary for students with a 6.8 GPA? Confidence Interval Prediction Interval

Holt Mcdougal Larson Pre-algebra: Student Edition 2012
1st Edition
ISBN:9780547587776
Author:HOLT MCDOUGAL
Publisher:HOLT MCDOUGAL
Chapter11: Data Analysis And Probability
Section11.4: Collecting Data
Problem 2E

Related questions
Topic Video
Question
What is the Prediction Interval (1 decimal)?
Lower value:
Upper value:
The Confidence Interval will be __________ (wider or narrower) than the Prediction Interval.
Which interval is the appropriate one to use when estimating the average starting salary for students with a 6.8 GPA?
Confidence Interval
Prediction Interval
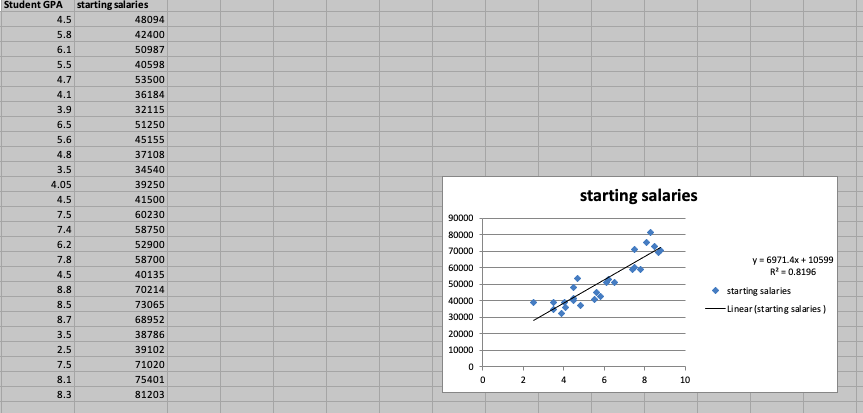
Transcribed Image Text:Student GPA
starting salaries
4.5
48094
5.8
42400
6.1
50987
5.5
40598
4.7
53500
4.1
36184
3.9
32115
6.5
51250
5.6
45155
4.8
37108
3.5
34540
4.05
39250
starting salaries
4.5
41500
7.5
60230
90000
7.4
58750
80000
6.2
52900
70000
y = 6971.4x + 10599
R = 0.8196
7.8
58700
60000
4.5
40135
50000
8.8
70214
starting salaries
40000
8.5
73065
-Linear (starting salaries )
8.7
68952
30000
3.5
38786
20000
2.5
39102
10000
7.5
71020
8.1
75401
2.
6.
10
8.3
81203
เก่ เก่
-00 00 oc
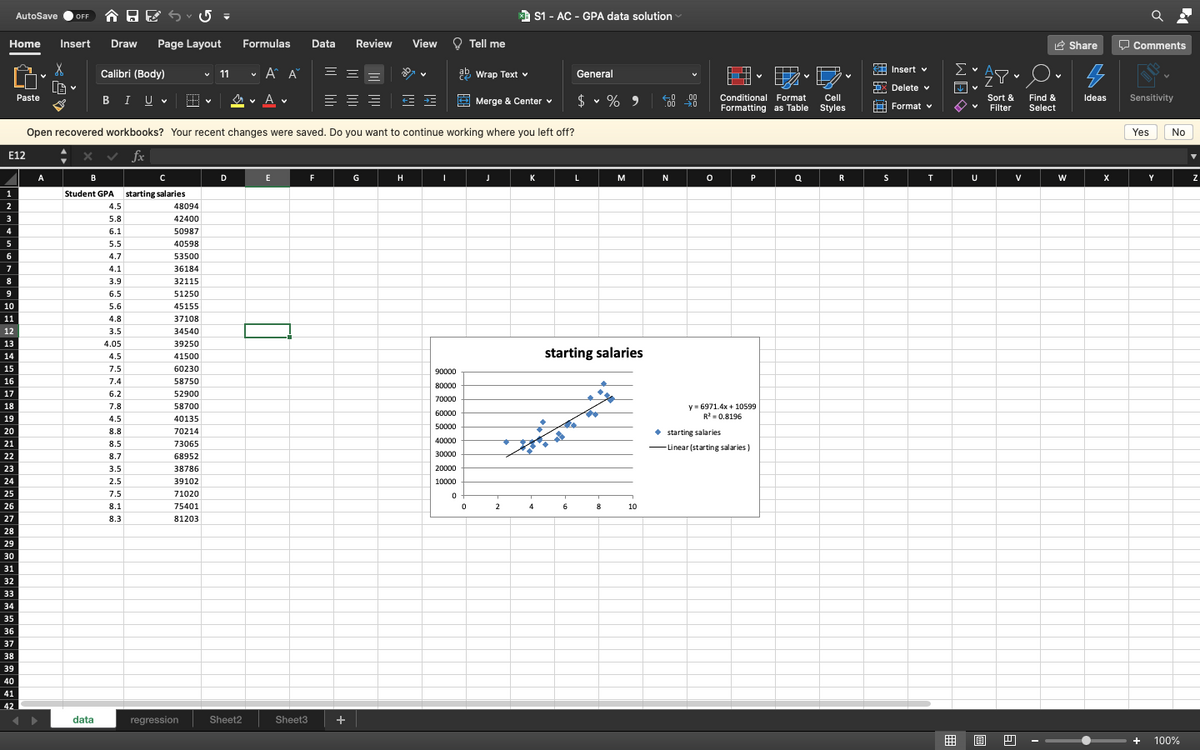
Transcribed Image Text:OFF A A E S
a S1 - AC - GPA data solution
AutoSave
Insert
Draw
Page Layout
Formulas
Data
Review
View
Q Tell me
O Comments
Home
2 Share
Σ.
“江"。.
Calibri (Body)
v A A
= =
ab wrap Text v
A Insert v
11
General
EX Delete v
4 v A v
Sensitivity
Paste
E Merge & Center v
$ v % 9
.00
.00 →0
Conditional Format
Formatting as Table Styles
Cell
Sort &
Filter
Find &
Select
BIUV
+= +=
Ideas
H Format v
Open recovered workbooks? Your recent changes were saved. Do you want to continue working where you left off?
Yes
No
E12
fx
A
D
E
G
H
K
L
N
P
S
V
X
Y
1
Student GPA
starting salaries
2
4.5
48094
5.8
42400
4
6.1
50987
5.5
40598
6.
4.7
53500
7
4.1
36184
8
3.9
32115
9
6.5
51250
10
5.6
45155
11
4.8
37108
12
3.5
34540
13
4.05
39250
starting salaries
14
4.5
41500
15
7.5
60230
90000
16
7.4
58750
80000
17
6.2
52900
70000
y = 6971.4x + 10599
R = 0.8196
18
7.8
58700
60000
19
4.5
40135
50000
20
8.8
70214
• starting salaries
40000
21
8.5
73065
-Linear (starting salaries )
22
8.7
68952
30000
23
3.5
38786
20000
24
2.5
39102
10000
25
7.5
71020
26
8.1
75401
2
4
6
8
10
27
8.3
81203
28
29
30
31
32
33
34
35
36
37
38
39
40
41
42
data
regression
Sheet2
Sheet3
囲
100%
Expert Solution
This question has been solved!
Explore an expertly crafted, step-by-step solution for a thorough understanding of key concepts.

Step by step
Solved in 5 steps with 13 images

Knowledge Booster


Learn more about
Need a deep-dive on the concept behind this application? Look no further. Learn more about this topic, statistics and related others by exploring similar questions and additional content below.Recommended textbooks for you
Holt Mcdougal Larson Pre-algebra: Student Edition…
Algebra
ISBN:
9780547587776
Author:
HOLT MCDOUGAL
Publisher:
HOLT MCDOUGAL
Holt Mcdougal Larson Pre-algebra: Student Edition…
Algebra
ISBN:
9780547587776
Author:
HOLT MCDOUGAL
Publisher:
HOLT MCDOUGAL