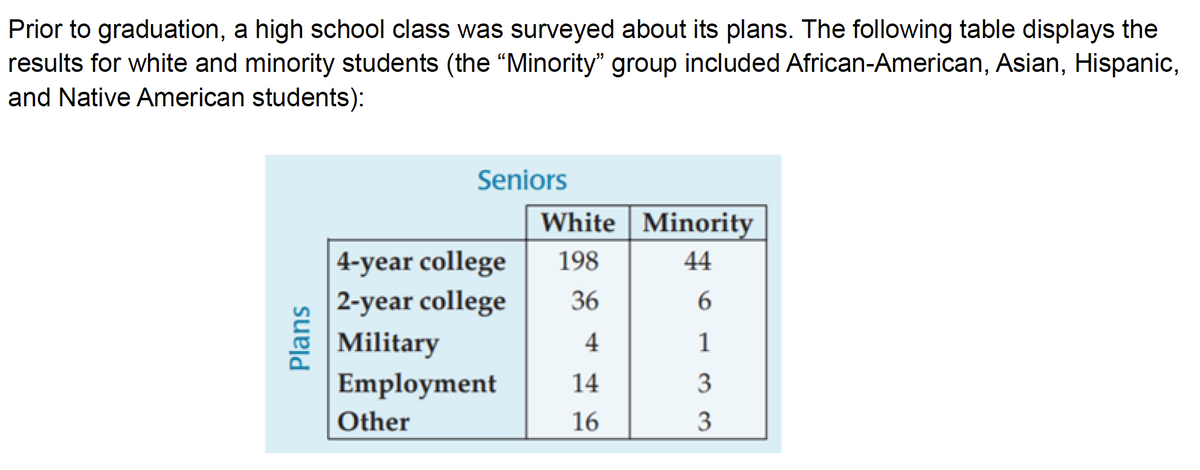
What percent (to the nearest whole number) of the total seniors that will attend a 2-year college are white?


Q: The histogram below represents the weights of employees that work at a local hardware store. 7…
A:
Q: The student government wants to implement chicken tenders in the dining hall every Friday. In order…
A: Given that, The student government wants to implement chicken tenders in the dining hall every…
Q: For questions 3 and 4, use the method demonstrated in Worked Example 6.6 to find the mean, median…
A: Central tendency is a measure of a variable that clusters around a central value that represents the…
Q: Refer to the sample data for polygraph tests shown below. If one of the test subjects is randomly…
A: Given that : No(Did not lie) Yes (Lie) Total Positive test results 15 46 61 Negative test…
Q: n of 0.56. At least Wildl and 9.48? 0% Band 8.927 69 CUDNIT QUESTION
A: Given that. Population mean =7.8 Population standard deviation =0.56
Q: 8.22 When the parent population is Normal (μ,σ) with known σ, then confi- dence intervals of the…
A: This question seeks to determine which of two methods for calculating a confidence interval using…
Q: Let X be a continuous random variable such that its 76-th percentile is 12. From the following…
A: given data continuous random variable. 76th percentile is 12. we have to find correct options.
Q: (a) What is the shape of the distribution of life expectancies for all countries? Symmetric. Skewed…
A: Here, given that the life expectancy for all the different countries are given. Also, tell that the…
Q: on's r is not symmetrical and we would need to transform it to z, calculate the CI then undo…
A: The dataset is given as: ID FFQ DR 340 7 0 399 7 0.5 466 0 0 502 0 0 541 0 0 554 7…
Q: How did you find how many test scores below 73 step by step?
A: The given test score is 73.
Q: a. Determine the 45th percentile. P45 Round to three decimal places if necessary 0.000 b. Determine…
A:
Q: Let Yit denote the outcome of a random variable for the i-th individual at time and let Xit denote a…
A: Note: In case of multiple subparts, answer to first three subparts will be provided as per the…
Q: Question 9 ✓ > You must estimate the mean temperature (in degrees Fahrenheit) with the following…
A: Given that Observation: XX X^2X2 1 30.1 906.01 2 29.9 894.01 3 42 1764 4 35.4 1253.16…
Q: 4. A study to assess the capability of subsurface flow wetland systems to remove biochemical oxygen…
A: Note: As per our multiple-subparts q&a guideline, we are solving three subparts as per request…
Q: Use the dataset "HT_3341.xls" and conduct a two-sample t-test using Excel. You'd like to test the…
A: We have given the data set of two samples (column A and column B) as follows, X1 X2 99.77 97.13…
Q: K About 10% of the population of a large country is nervous around strangers. If two people are…
A: Let X be the random variable from binomial distribution with probability (p) = 10% = 0.10 and sample…
Q: Determine the following for the following joint probability distribution: X y fxy(x,y) a. E(XY) = b.…
A: Note: According to Bartleby guidelines expert solve only one question and maximum three subpart of…
Q: Suppose that we number the marbles from 1 to 10. What is the probability of picking out number 87 1%…
A: Given We number the marbles from 1 to 10 I.e the total number of marbles =10
Q: Cadmium. The data below are influent and effluent cadmium at a wastewater treatment plant. Use…
A: Given Information: Consider the given dataset: Influent effluent 2.5 0.8 2.3 1 2.5 0 2.8…
Q: For this scenario, write out the hypotheses to be put to the test and define the parameter of…
A: Given that The World Bank, 10.7 percent of the world's population lived in poverty in 2013.…
Q: Q3. Two quality control technicians measured the surface finish of a metal part, obtaining the data…
A: Let, x denotes technician -1 and y denotes technician -2. The dataset is given as: x y 1.45…
Q: Assume that adults have IQ scores that are normally distributed with a mean of 104.9 and a standard…
A: normal distribution, μ=104.9σ=21.5 first quartile for the given data=?
Q: 1. Suppose you have a simple linear regression model with 51 observations. (a) You know that the…
A: Given that, The simple linear regression model with 51 observations. N=51 The estimated error…
Q: research regarding "Should post exercise meal consumption differ for athletes compared to casual"…
A: Answer :- There is a growing body of research on post-exercise nutrition, with a particular focus on…
Q: A candy bar manufacturer sells a "fun size" version that is advertised to weigh 17 grams. A hungry…
A: Given information: 95% confidence interval for the true mean weight to be 16.945 and 17.395 grams.…
Q: Match the following terms with the correct definitions or examples. Bias Sample - Random Sample -…
A: The sample, which essentially tends to over-represent (or under-represent) some of the elements at…
Q: 1.)Make a scatter plots by sex for VistsPerWeek vs. Friends for those in the Facebook_Survey_Sample…
A: Here, we have given the Facebook survey sample data in the question. Also, some information is…
Q: Which of the following is the point estimate (i.e., "best guess") for the population proportion of…
A: It is given that the statement about to the point estimate for the population proportion. Here, need…
Q: Many questions in research can be expressed as two competing statements about the population…
A: Given that, 40% of all supermarkets in the US use recyclable plastic bags. The researcher wants to…
Q: 0 3 6 12 15 18 21 Based on the histograms, what is the most likely value of the population mean? A.…
A: Fr the given three hostogram for the different sample sizes the population mean
Q: (a) Compute a 95% CI for the mean age (in years). (Enter your answer using interval notation. Round…
A: Let x1=Age And x2=First WBC (x, 1000) Following Admission The data is given as follow, Id Age x1…
Q: inst the null hypothesis
A:
Q: 2. Two events A and B are such that P(A)=0.21, P(B) = 0.29, P(A|B)=; 29 Calculate the probabilities…
A: P(A) = 0.21P(B) = 0.29P(A|B) = 829
Q: An electrical firm manufactures light bulbs that have a length of life that is approximately…
A: GivenMean(μ)=800standard deviation(σ)=40
Q: Let us consider the exponential distribution with density function ƒ(y]) = Ge i.i.d. sample Y;…
A: For the following data 1 0.4 2 0.0 3 0.2 4 0.1 5 2.1 6 0.1 7 0.9 8 2.4 9 0.1…
Q: A distribution of a single statistic from repeated random samples of the same size from the same…
A:
Q: In a multiple regression analysis, k = 5 and n = 20, the MSE value is 5.10, and SS total is 519.68.…
A:
Q: Independent samples from two populations are taken, and a t-statistic is used to test the null…
A: Given The data is as follows: H0: μ1=μ2Ha: μ1>μ2 The p-value is 0.04.
Q: If you buy a computer directly from the manufacturer for $2.291 and agree to repay it in 48 equal…
A: Given:- principal loan amount P = 2291 Interest per month I = 1.64 %…
Q: Historically, the average score of PGA golfers for one round is 74 with a standard deviation of…
A: Given,sample size(n)=110mean(μ)=74standard deviation(σ)=3.91
Q: Refer to a study of the factors that lead to successful performance-based logistics projects. Recall…
A: Given information: The data for the experience for the 5 commercial suppliers is given.
Q: A probability experiment consists of rolling a fair 14-sided die. Find the probability of the event…
A: Given that Ab experiment consists of rolling a fair 14-sided die.
Q: How did you find the percent of students who scored above an 84 step by step?
A: The given score is 84.
Q: 9. A dermatologist is interested in whether a new treatment for poison ivy would reduce symptoms…
A: We have to form the null an alternative hypothesis according to the desire of the given question.
Q: Global Happiness: Everything Up to the Paired-Samples t Test For the level represented by a…
A: Paired sample t-test : It is the test which compair the means of two groups taken from the same…
Q: The sample standard deviation is an unbiased estimator of the population standard deviation
A: Note: According to Bartleby guidelines expert solve only one question and rest can be reposted.
Q: Daniel Sam Number of Points Scored .. 2 4 6 8 10 12 14 16 18 20 22 24 Number of Points Scored 2 4 6…
A: The median of a variable is the value of n+12th observation when n is odd and the average of n2th…
Q: According to the DELCAZO stores, the average price of the new YUDA Surf beach shoes for people who…
A: Given that Mean=33.25, Standard deviations=13.30
Q: 2. (a) Give the 5-number summary for the data set in Problem 1 above. Show how you obtain them. (b)…
A: The given data is in ascending order as:…
Q: Exercise 6B For questions 1 and 2, use the method demonstrated in Worked Example 6.5 to complete the…
A: “Since you have posted multiple questions, we will provide the solution only to the first question…
What percent (to the nearest whole number) of the total seniors that will attend a 2-year college are white?


Trending now
This is a popular solution!

Step by step
Solved in 2 steps with 2 images

- The table below lists the annual salaries (in dollars) for a sample of 12 high school math teachers in Lousiana and 10 high school math teachers in Florida. Test the claim that high school math teachers in Louisiana get paid more than those in Florida using α=0.10. Louisiana 42300 45500 42100 39600 41500 43700 42500 43200 38400 36800 40100 42500 Florida 38600 35200 33700 41400 40600 39400 37500 36800 42100 36900 Let population 1 be Louisiana high school math teachers and population 2 be Florida high school math teachers. Round the test statistic to two decimal places, and round the p-value to four decimal places. The test statistic is . The p-value is . Should the null hypothesis be rejected?The Government of Pakistan publishes information about Corona virus Cases in Pakistan. The following contingency table provides a cross classification of cities of Pakistan and Covid-19 Stats. City Covid-19 Stats Confirmed Cases Active Cases Deaths Recoveries AJK 271 95 6 170 Balochistan 4514 2900 49 1565 Islamabad 2898 2694 30 169 KPK 10485 7030 482 2973 Punjab 27850 20194 540 7116 Sindh 29647 14554 503 14590 At the 5% significance level, do the data provide sufficient evidence to conclude than an association exists between cities and Covid-19 stats?Ashton surveyed the students in his neighborhood and obtained the following contingency table that summarizes the school enrollment by level and type:
- The manager of the customer service division of a major consumer electronics company is interested in determining whether the customers who have purchased a DVD player made by the company over the past 12 months are satisfied with their products.This table summarizes the results of a prospective study for a disease and a vaccine to prevent that disease. Disease Not Disease Vaccine 45 300, 245 300,290 No Vaccine 215 315,650 315,865 260 615,895 616,155 Which is the appropriate notation to express the risk of disease for those in the vaccination group? Group of answer choices P(disease)xP(vaccine) 1- P(disease) P(vaccine | disease) P(disease | vaccine) P( disease )A study was conducted in 1997 to measure the total fat content, calories, and sodium content of vegetable burgers available at supermarkets and commonly used as a meat substitute. Measurements on 54 different brands of "veggie burgers," and the results were used to develop the 3-way contingency table below. Under 130 Calories Under 130 Calories 130 Calories or More 130 Calories of More Total Fat Content Under 320 g Sodium 320 g Sodium or More Under 320 g of Sodium 320 g Sodium or More Under 3 g 6 12 1 1 3-4 g 7 4 3 5 Over 4 g 1 1 7 6 A= {"Under 130 Calories"}, B= {"320 g Sodium or More"} C= {"Over 4 g Total Fat"} A vegetable burger is selected randomly from the group. Find the following probabilities: Please Answer D, E, F (d.) P(A and B) (e.) P(A and B and C) (f.) P(A or B)
- A study was conducted in 1997 to measure the total fat content, calories, and sodium content of vegetable burgers available at supermarkets and commonly used as a meat substitute. Measurements on 54 different brands of "veggie burgers," and the results were used to develop the 3-way contingency table below. Under 130 Calories Under 130 Calories 130 Calories or More 130 Calories of More Total Fat Content Under 320 g Sodium 320 g Sodium or More Under 320 g of Sodium 320 g Sodium or More Under 3 g 6 12 1 1 3-4 g 7 4 3 5 Over 4 g 1 1 7 6 A= {"Under 130 Calories"}, B= {"320 g Sodium or More"} C= {"Over 4 g Total Fat"} A vegetable burger is selected randomly from the group. Find the following probabilities: Please Answer A, B, & C (a.) P(A) (b.) P(B) (c.) P(C)A nationwide company specializing in preparing students for college and graduate school entrance exams, such as the SAT, ACT, and LSAT, had the business objective of improving its ACT preparatory course. Two factors of interest to the company are the length of the course (a condensed 10-day period or a regular 30-day period) and the type of course (traditional classroom or online distance learning). The company collected data by randomly assigning 10 clients to each of the four cells that represent a combination of length of the course and type of course. The results are organized and presented in the following table: LENGTH OF COURSE TYPE OF COURSE Condensed Regular Traditional 26 18 34 28 27 24 24 21 25 19 35 23 21…Dean for student affairs of a small university is worried about students’ expenditure on internet expense during the period study from home since this Covid-19 outbreak. Especially she wants to know whether students of social sciences spend more compared to students from science and technology. As a quick and preliminary study, she collected a sample of 9 students from science and technology and 11 students from social sciences. Total spending for internet is in Rp0000 during the month of April 2029. The results are presented in the following table. Questions: 1. Explain whether you can or cannot use normal approach to the case. 2. Conduct the test by showing formal steps in hypothesis test (design, decision rule, statistical test, and conclusion) at α = 0.05
- A electronics retailer list the sales (in thousands) of certain products in three cities for the prior quarter. During that period tablets sold for $241, laptops sold for $505, cell phones sold for $437, and DVR sold for $1,564. City 1 City 2 City 3 Tablets 4444 5757 3939 Laptop Computers 6464 7777 6868 Cell Phones 3131 5353 6969 Personal DVR 3030 7676 5454 City 1's total sales : City 2's total sales : City 3's total sales :The following table contains the results of a survey of daily rental rates of a mid-size car for three major rental car companies at three airport locations on three different days during the year. Is there sufficient evidence to conclude that there is a significant difference among the average daily rental rates for mid-size cars for the three rental car companies? Daily Rental Rates of Mid-Size Cars ($) New York Chicago Miami Hertz 83.9983.99 81.9981.99 73.9973.99 89.9989.99 91.9991.99 45.9945.99 77.9977.99 89.9989.99 72.9972.99 Avis 75.8675.86 77.9977.99 70.9970.99 45.1045.10 86.9986.99 60.9960.99 48.9848.98 97.9997.99 90.9990.99 National 80.0080.00 75.9975.99 57.0057.00 56.0056.00 71.0071.00 53.9953.99 56.0056.00 77.9977.99 67.9967.99 Copy Data ANOVA Source of Variation SSSS dfdf MSMS Company 709.6404709.6404 22 354.8202354.8202 Location 1631.71781631.7178 22 815.8589815.8589 Interaction 1157.83361157.8336 44 289.4584289.4584 Within…Due to COVID19, airlines cut services, such as meals and snacks during flights, and started charging for luggage. However, they are still concerned about service. A group of four carriers hired Denny's Marketing Research Inc. to survey passengers regarding their level of satisfaction with a recent flight. The survey included questions on ticketing, boarding, in-flight service, baggage handling, pilot communication, and so forth. Twenty-five questions offered a range of possible answers: excellent, good, fair, or poor. A response of excellent was given a score of 4, good a 3, fair a 2, and poor a 1. These responses were then totaled, so the total score was an indication of the satisfaction with the flight. The greater the score, the higher the level of satisfaction with the service. The highest possible score was 100. Denny randomly selected and surveyed passengers from the four airlines. Below is the sample information. Is there a difference in the mean satisfaction level among the…