
Chapter6: Tracking The U.s. Economy
Section: Chapter Questions
Problem 1.2P

Related questions
Question
what is the real
![Refer to Table 1(year 2018) and Table 2 (year 2019).
What is the real GDP for year 2019?
Table 2: (1+F- E VK * 100
Table 2: (B+C+D+E+F+G/K * 100
(Table 1: A+B+C) / (Table 2: K) *100
None of these
O [Table 1: A+B+C) * (1 + Table 2: H) ]/ (Table2: K) *100
(Table 1: A+B+C) / (Table 2: J) *100](/v2/_next/image?url=https%3A%2F%2Fcontent.bartleby.com%2Fqna-images%2Fquestion%2F004a591f-eafb-400f-a3e4-7bb972ff1b7c%2F445db405-f7e3-41bc-a253-d6057eeee9d9%2F5a9mzc8_processed.png&w=3840&q=75)
Transcribed Image Text:Refer to Table 1(year 2018) and Table 2 (year 2019).
What is the real GDP for year 2019?
Table 2: (1+F- E VK * 100
Table 2: (B+C+D+E+F+G/K * 100
(Table 1: A+B+C) / (Table 2: K) *100
None of these
O [Table 1: A+B+C) * (1 + Table 2: H) ]/ (Table2: K) *100
(Table 1: A+B+C) / (Table 2: J) *100
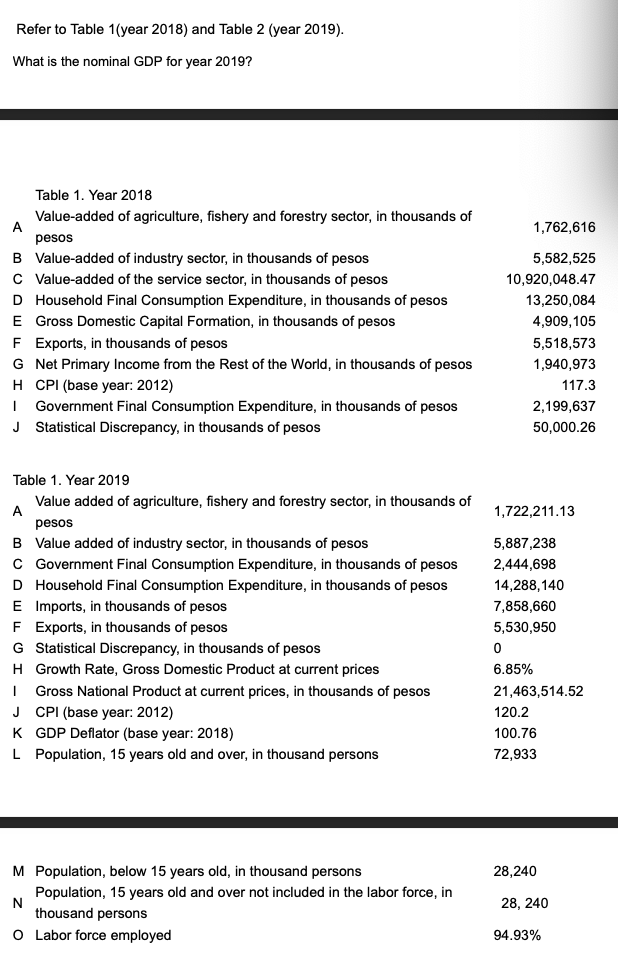
Transcribed Image Text:Refer to Table 1(year 2018) and Table 2 (year 2019).
What is the nominal GDP for year 2019?
Table 1. Year 2018
Value-added of agriculture, fishery and forestry sector, in thousands of
A
pesos
1,762,616
B Value-added of industry sector, in thousands of pesos
c Value-added of the service sector, in thousands of pesos
D Household Final Consumption Expenditure, in thousands of pesos
E Gross Domestic Capital Formation, in thousands of pesos
F Exports, in thousands of pesos
G Net Primary Income from the Rest of the World, in thousands of pesos
H CPI (base year: 2012)
I Government Final Consumption Expenditure, in thousands of pesos
J Statistical Discrepancy, in thousands of pesos
5,582,525
10,920,048.47
13,250,084
4,909,105
5,518,573
1,940,973
117.3
2,199,637
50,000.26
Table 1. Year 2019
Value added of agriculture, fishery and forestry sector, in thousands of
A
1,722,211.13
pesos
B Value added of industry sector, in thousands of pesos
C Government Final Consumption Expenditure, in thousands of pesos
D Household Final Consumption Expenditure, in thousands of pesos
E Imports, in thousands of pesos
F Exports, in thousands of pesos
G Statistical Discrepancy, in thousands of pesos
5,887,238
2,444,698
14,288,140
7,858,660
5,530,950
H Growth Rate, Gross Domestic Product at current prices
6.85%
Gross National Product at current prices, in thousands of pesos
21,463,514.52
J CPI (base year: 2012)
K GDP Deflator (base year: 2018)
L Population, 15 years old and over, in thousand persons
120.2
100.76
72,933
M Population, below 15 years old, in thousand persons
28,240
Population, 15 years old and over not included in the labor force, in
N
thousand persons
28, 240
O Labor force employed
94.93%
Expert Solution
This question has been solved!
Explore an expertly crafted, step-by-step solution for a thorough understanding of key concepts.

Step by step
Solved in 2 steps

Knowledge Booster


Learn more about
Need a deep-dive on the concept behind this application? Look no further. Learn more about this topic, economics and related others by exploring similar questions and additional content below.Recommended textbooks for you

Economics: Private and Public Choice (MindTap Cou…
Economics
ISBN:
9781305506725
Author:
James D. Gwartney, Richard L. Stroup, Russell S. Sobel, David A. Macpherson
Publisher:
Cengage Learning

Macroeconomics: Private and Public Choice (MindTa…
Economics
ISBN:
9781305506756
Author:
James D. Gwartney, Richard L. Stroup, Russell S. Sobel, David A. Macpherson
Publisher:
Cengage Learning
Economics: Private and Public Choice (MindTap Cou…
Economics
ISBN:
9781305506725
Author:
James D. Gwartney, Richard L. Stroup, Russell S. Sobel, David A. Macpherson
Publisher:
Cengage Learning
Macroeconomics: Private and Public Choice (MindTa…
Economics
ISBN:
9781305506756
Author:
James D. Gwartney, Richard L. Stroup, Russell S. Sobel, David A. Macpherson
Publisher:
Cengage Learning

Brief Principles of Macroeconomics (MindTap Cours…
Economics
ISBN:
9781337091985
Author:
N. Gregory Mankiw
Publisher:
Cengage Learning

Essentials of Economics (MindTap Course List)
Economics
ISBN:
9781337091992
Author:
N. Gregory Mankiw
Publisher:
Cengage Learning

Principles of Economics 2e
Economics
ISBN:
9781947172364
Author:
Steven A. Greenlaw; David Shapiro
Publisher:
OpenStax