What is the relationship between the amount of time statistics students study per week and their final exam scores? The results of the survey are shown below. Time 13 2 16 15 10 8. Score 52 89 52 88 93 66 74 90 66 a. Find the correlation coefficient: T = Round to 2 decimal places. b. The null and alternative hypotheses for correlation are: Ho: ? = O Hị: ?v 0 The p-value is: (Round to four decimal places) c. Use a level of significance of a = 0.05 to state the conclusion of the hypothesis test in the context of the study.
What is the relationship between the amount of time statistics students study per week and their final exam scores? The results of the survey are shown below. Time 13 2 16 15 10 8. Score 52 89 52 88 93 66 74 90 66 a. Find the correlation coefficient: T = Round to 2 decimal places. b. The null and alternative hypotheses for correlation are: Ho: ? = O Hị: ?v 0 The p-value is: (Round to four decimal places) c. Use a level of significance of a = 0.05 to state the conclusion of the hypothesis test in the context of the study.

Chapter4: Linear Functions
Section: Chapter Questions
Problem 30PT: For the following exercises, use Table 4 which shows the percent of unemployed persons 25 years or...

Related questions
Topic Video
Question
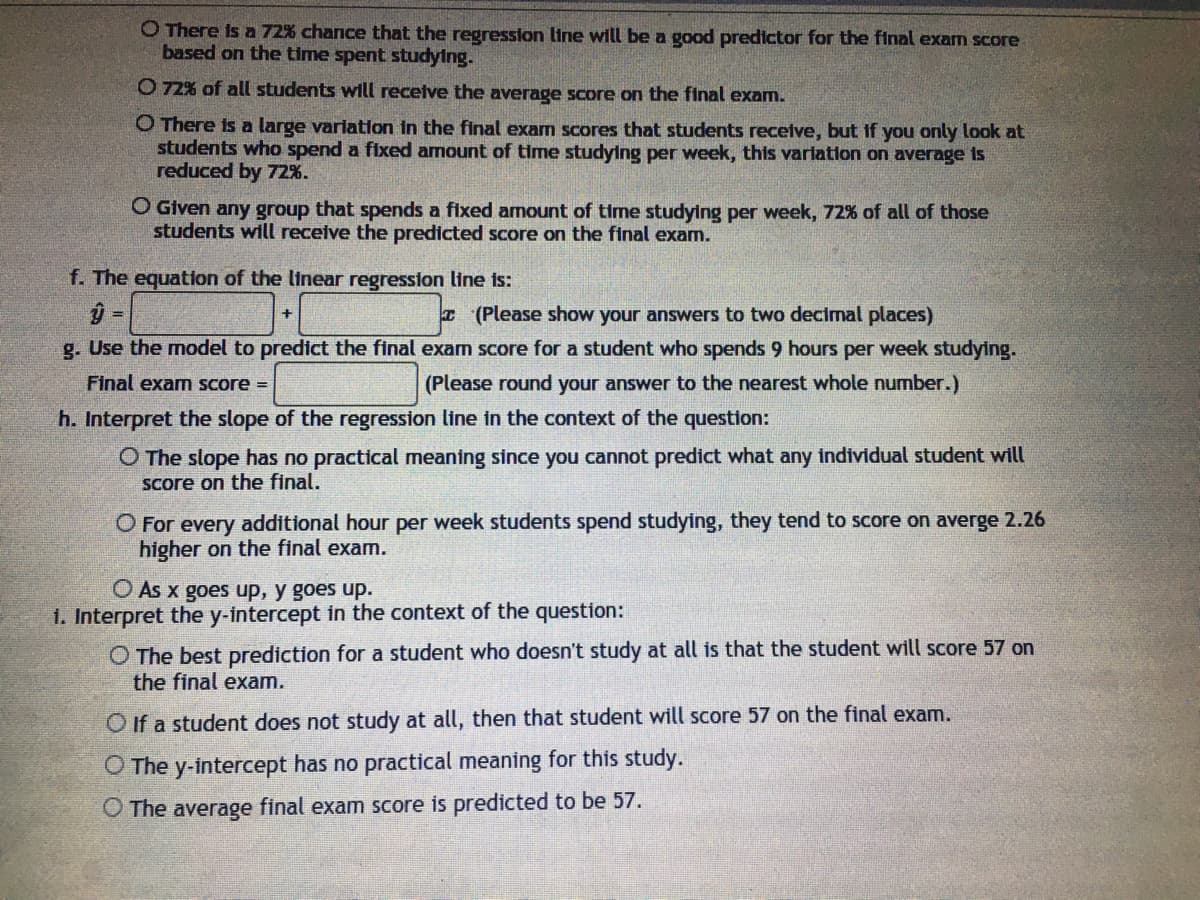
Transcribed Image Text:O There is a 72% chance that the regression line will be a good predictor for the final exam score
based on the time spent studying.
O 72% of all students will recetve the average score on the final exam.
O There is a large variation in the final exam scores that students receive, but if you only look at
students who spend a fixed amount of time studying per week, this varlation on average is
reduced by 72%.
O Given any group that spends a fixed amount of time studying per week, 72% of all of those
students will receive the predicted score on the final exam.
f. The equation of the linear regression line is:
I (Please show your answers to two decimal places)
g. Use the model to predict the final exam score for a student who spends 9 hours per week studying.
Final exam score =
(Please round your answer to the nearest whole number.)
h. Interpret the slope of the regression line in the context of the question:
O The slope has no practical meaning since you cannot predict what any individual student will
Score on the final.
O For every additional hour per week students spend studying, they tend to score on averge 2.26
higher on the final exam.
O As x goes up, y goes up.
1. Interpret the y-intercept in the context of the question:
O The best prediction for a student who doesn't study at all is that the student will score 57 on
the final exam.
O If a student does not study at all, then that student will score 57 on the final exam.
O The y-intercept has no practical meaning for this study.
O The average final exam score is predicted to be 57.
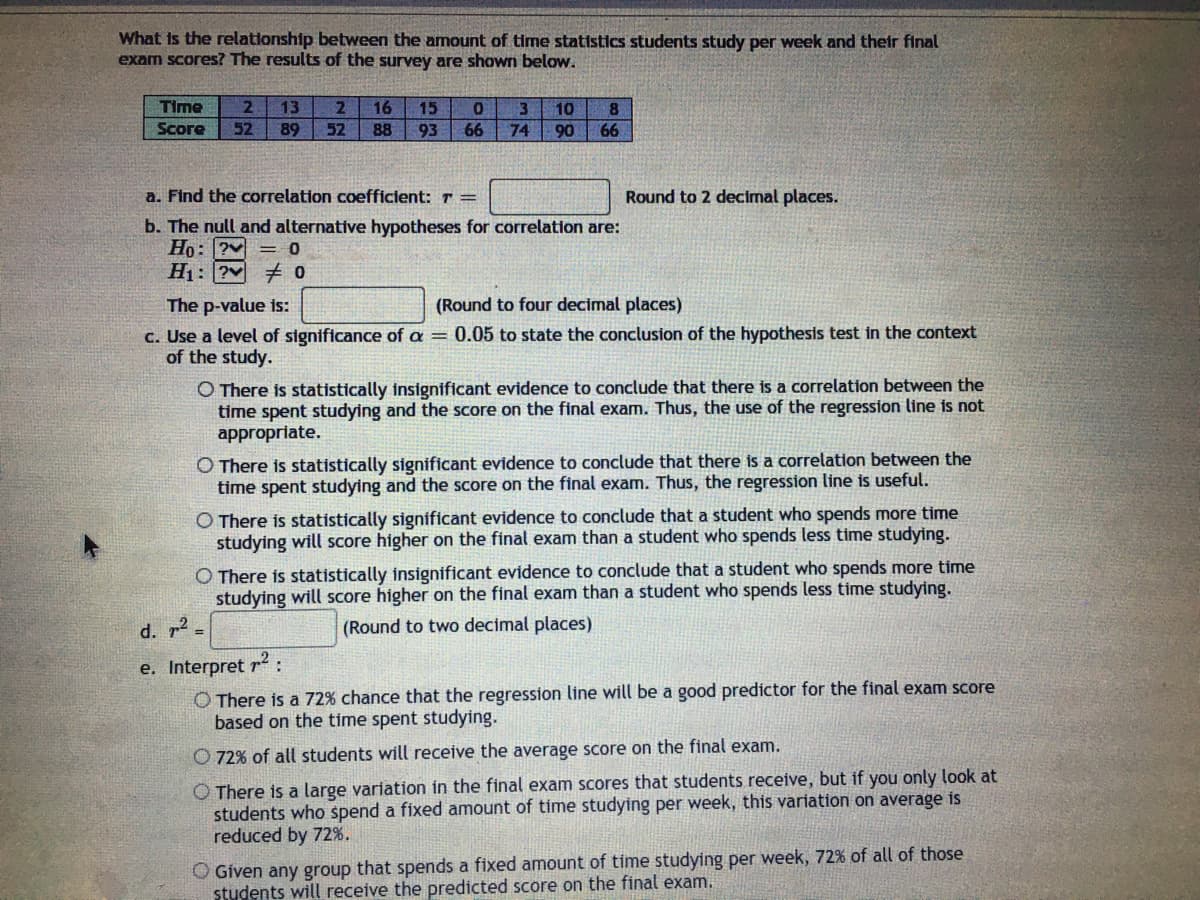
Transcribed Image Text:What is the relationship between the amount of time statistics students study per week and their final
exam scores? The results of the survey are shown below.
Time
16
3.
90
13
15
10
Score
52
89
52
88
93
66
74
66
a. Find the correlation coefficient: T =
Round to 2 decimal places.
b. The null and alternative hypotheses for correlation are:
Ho: ? = 0
Hị: ?v # O
The p-value is:
(Round to four decimal places)
c. Use a level of significance of a = 0.05 to state the conclusion of the hypothesis test in the context
of the study.
O There is statistically insignificant evidence to conclude that there is a correlation between the
time spent studying and the score on the final exam. Thus, the use of the regression line is not
appropriate.
O There is statistically significant evidence to conclude that there is a correlation between the
time spent studying and the score on the final exam. Thus, the regression line is useful.
O There is statistically significant evidence to conclude that a student who spends more time
studying will score higher on the final exam than a student who spends less time studying.
O There is statistically insignificant evidence to conclude that a student who spends more time
studying will score higher on the final exam than a student who spends less time studying.
d. r2-
(Round to two decimal places)
%3D
e. Interpret r:
O There is a 72% chance that the regression line will be a good predictor for the final exam score
based on the time spent studying.
O 72% of all students will receive the average score on the final exam.
O There is a large variation in the final exam scores that students receive, but if you only look at
students who spend a fixed amount of time studying per week, this variation on average is
reduced by 72%.
O Given any group that spends a fixed amount of time studying per week, 72% of all of those
students will receive the predicted score on the final exam.
Expert Solution
This question has been solved!
Explore an expertly crafted, step-by-step solution for a thorough understanding of key concepts.

Step by step
Solved in 2 steps with 1 images

Knowledge Booster


Learn more about
Need a deep-dive on the concept behind this application? Look no further. Learn more about this topic, statistics and related others by exploring similar questions and additional content below.Recommended textbooks for you

Glencoe Algebra 1, Student Edition, 9780079039897…
Algebra
ISBN:
9780079039897
Author:
Carter
Publisher:
McGraw Hill
Glencoe Algebra 1, Student Edition, 9780079039897…
Algebra
ISBN:
9780079039897
Author:
Carter
Publisher:
McGraw Hill