What is the relationship between the attendance at a major league ball game and the total number of runs Scored? Attendance figures (in thousands) and the runs scored for 10 randomly selected games are shown below. Attendance 26 46 57 43 37 35 40 27 12 13 25 Runs 10 4. 14 10 12 9. 11 a. Find the correlation coefficient: r= Round to 2 decimal places. b. The null and alternative hypotheses for correlation are: Ho: ? v H1: ?v The p-value is: (Round to four decimal places) c. Use a level of significance of a = 0.05 to state the conclusion of the hypothesis test in the context of the study. %3D O There is statistically insignificant evidence to conclude that there is a correlation between the attendance of baseball games and the runs scored. Thus, the use of the regression line is not appropriate. O There is statistically significant evidence to conclude that a game with a higher attendance will have more runs scored than a game with lower attendance. O There is statistically significant evidence to conclude that a game with higher attendance will have fewer runs scored than a game with lower attendance. O There is statistically significant evidence to conclude that there is a correlation between the attendance of baseball games and the runs scored. Thus, the regression line is useful.
What is the relationship between the attendance at a major league ball game and the total number of runs Scored? Attendance figures (in thousands) and the runs scored for 10 randomly selected games are shown below. Attendance 26 46 57 43 37 35 40 27 12 13 25 Runs 10 4. 14 10 12 9. 11 a. Find the correlation coefficient: r= Round to 2 decimal places. b. The null and alternative hypotheses for correlation are: Ho: ? v H1: ?v The p-value is: (Round to four decimal places) c. Use a level of significance of a = 0.05 to state the conclusion of the hypothesis test in the context of the study. %3D O There is statistically insignificant evidence to conclude that there is a correlation between the attendance of baseball games and the runs scored. Thus, the use of the regression line is not appropriate. O There is statistically significant evidence to conclude that a game with a higher attendance will have more runs scored than a game with lower attendance. O There is statistically significant evidence to conclude that a game with higher attendance will have fewer runs scored than a game with lower attendance. O There is statistically significant evidence to conclude that there is a correlation between the attendance of baseball games and the runs scored. Thus, the regression line is useful.

Chapter4: Linear Functions
Section4.3: Fitting Linear Models To Data
Problem 34SE: For the following exercises, consider this scenario: The profit of a company decreased steadily...

Related questions
Question
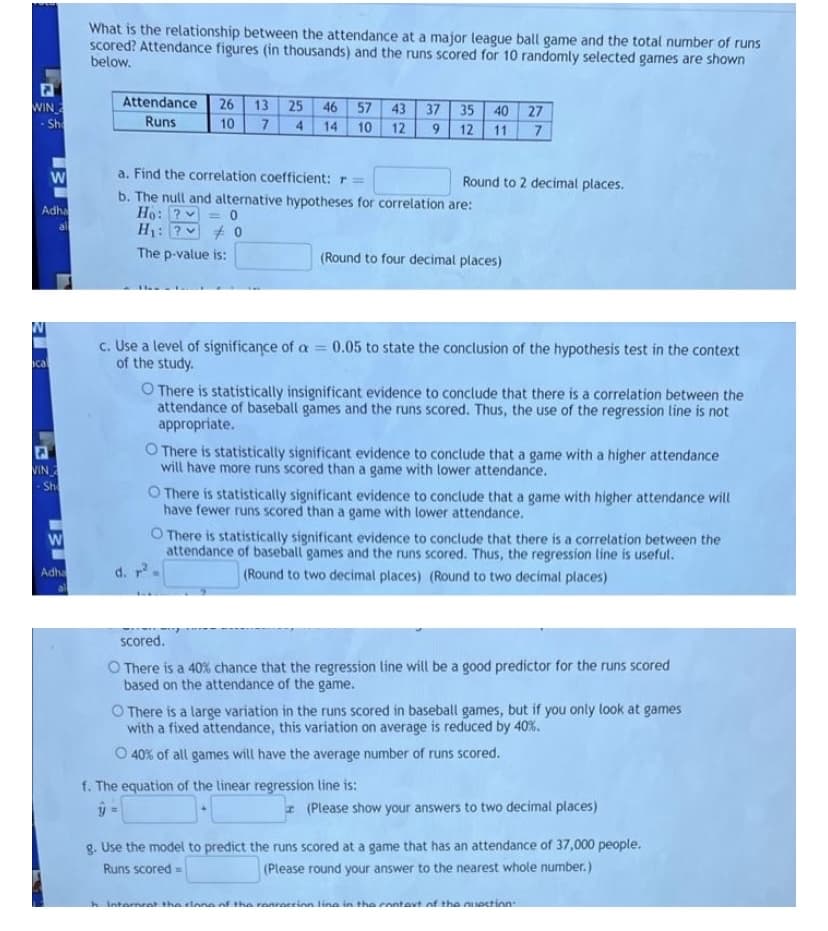
Transcribed Image Text:What is the relationship between the attendance at a major league ball game and the total number of runs
scored? Attendance figures (in thousands) and the runs scored for 10 randomly selected games are shown
below.
WIN
Attendance
26
13 25 46 57 43
37 35 40 27
Sh
Runs
10
4
14
11 7
10
12
9.
12
a. Find the correlation coefficient: r =
Round to 2 decimal places.
b. The null and alternative hypotheses for correlation are:
Ho: ?v
H1: ?v
Adha
al
The p-value is:
(Round to four decimal places)
c. Use a level of significance of a 0.05 to state the conclusion of the hypothesis test in the context
of the study.
ical
O There is statistically insignificant evidence to conclude that there is a correlation between the
attendance of baseball games and the runs scored. Thus, the use of the regression line is not
appropriate.
O There is statistically significant evidence to conclude that a game with a higher attendance
will have more runs scored than a game with lower attendance.
VIN
- Sh
O There is statistically significant evidence to conclude that a game with higher attendance will
have fewer runs scored than a game with lower attendance.
O There is statistically significant evidence to conclude that there is a correlation between the
attendance of baseball games and the runs scored. Thus, the regression line is useful.
Adha
d. r
(Round to two decimal places) (Round to two decimal places)
scored.
O There is a 40% chance that the regression line will be a good predictor for the runs scored
based on the attendance of the game.
O There is a large variation in the runs scored in baseball games, but if you only look at games
with a fixed attendance, this variation on average is reduced by 40%.
O 40% of all games will have the average number of runs scored.
f. The equation of the linear regression line is:
I (Please show your answers to two decimal places)
g. Use the model to predict the runs scored at a game that has an attendance of 37,000 people.
(Please round your answer to the nearest whole number. )
Runs scored =
h Internrat the clone of the renreccinn line in the enntavt of tha nuection
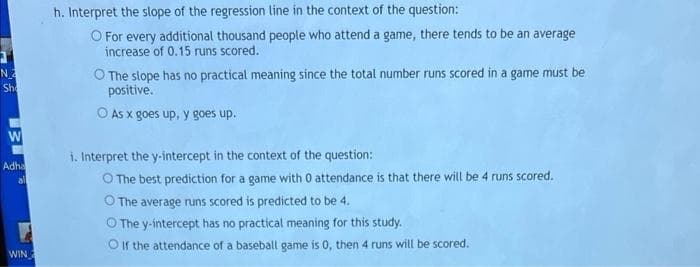
Transcribed Image Text:h. Interpret the slope of the regression line in the context of the question:
O For every additional thousand people who attend a game, there tends to be an average
increase of 0.15 runs scored.
N
Sh
O The slope has no practical meaning since the total number runs scored in a game must be
positive.
O As x goes up, y goes up.
i. Interpret the y-intercept in the context of the question:
Adha
all
O The best prediction for a game with 0 attendance is that there will be 4 runs scored.
O The average runs scored is predicted to be 4.
O The y-intercept has no practical meaning for this study.
O If the attendance of a baseball game is 0, then 4 runs will be scored.
WIN
Expert Solution
This question has been solved!
Explore an expertly crafted, step-by-step solution for a thorough understanding of key concepts.

Step by step
Solved in 2 steps with 5 images

Recommended textbooks for you


Functions and Change: A Modeling Approach to Coll…
Algebra
ISBN:
9781337111348
Author:
Bruce Crauder, Benny Evans, Alan Noell
Publisher:
Cengage Learning
Functions and Change: A Modeling Approach to Coll…
Algebra
ISBN:
9781337111348
Author:
Bruce Crauder, Benny Evans, Alan Noell
Publisher:
Cengage Learning

Algebra & Trigonometry with Analytic Geometry
Algebra
ISBN:
9781133382119
Author:
Swokowski
Publisher:
Cengage

Glencoe Algebra 1, Student Edition, 9780079039897…
Algebra
ISBN:
9780079039897
Author:
Carter
Publisher:
McGraw Hill

Algebra and Trigonometry (MindTap Course List)
Algebra
ISBN:
9781305071742
Author:
James Stewart, Lothar Redlin, Saleem Watson
Publisher:
Cengage Learning