What is the relationship between total product, average product and marginal product. draw the graph and explain it. how can you differentiate between short time period and long time period Table Table 16.1: Returns to Labour Units of Labour Total Product (Quintals) Marginal Product (Quintals) Average Product (Quintals) AL 80 80 - 80 170 270 90 83 100 90 368 430 98 62 S0 92 86 80 24 72 63 495 480 -9 SS 10 -15 48
What is the relationship between total product, average product and marginal product. draw the graph and explain it. how can you differentiate between short time period and long time period Table Table 16.1: Returns to Labour Units of Labour Total Product (Quintals) Marginal Product (Quintals) Average Product (Quintals) AL 80 80 - 80 170 270 90 83 100 90 368 430 98 62 S0 92 86 80 24 72 63 495 480 -9 SS 10 -15 48

Principles of Economics 2e
2nd Edition
ISBN:9781947172364
Author:Steven A. Greenlaw; David Shapiro
Publisher:Steven A. Greenlaw; David Shapiro
Chapter7: Production, Costs, And Industry Structure
Section: Chapter Questions
Problem 28RQ: What shape of a long-run average cost curve illustrates economies of scale, constant returns to...

Related questions

Question
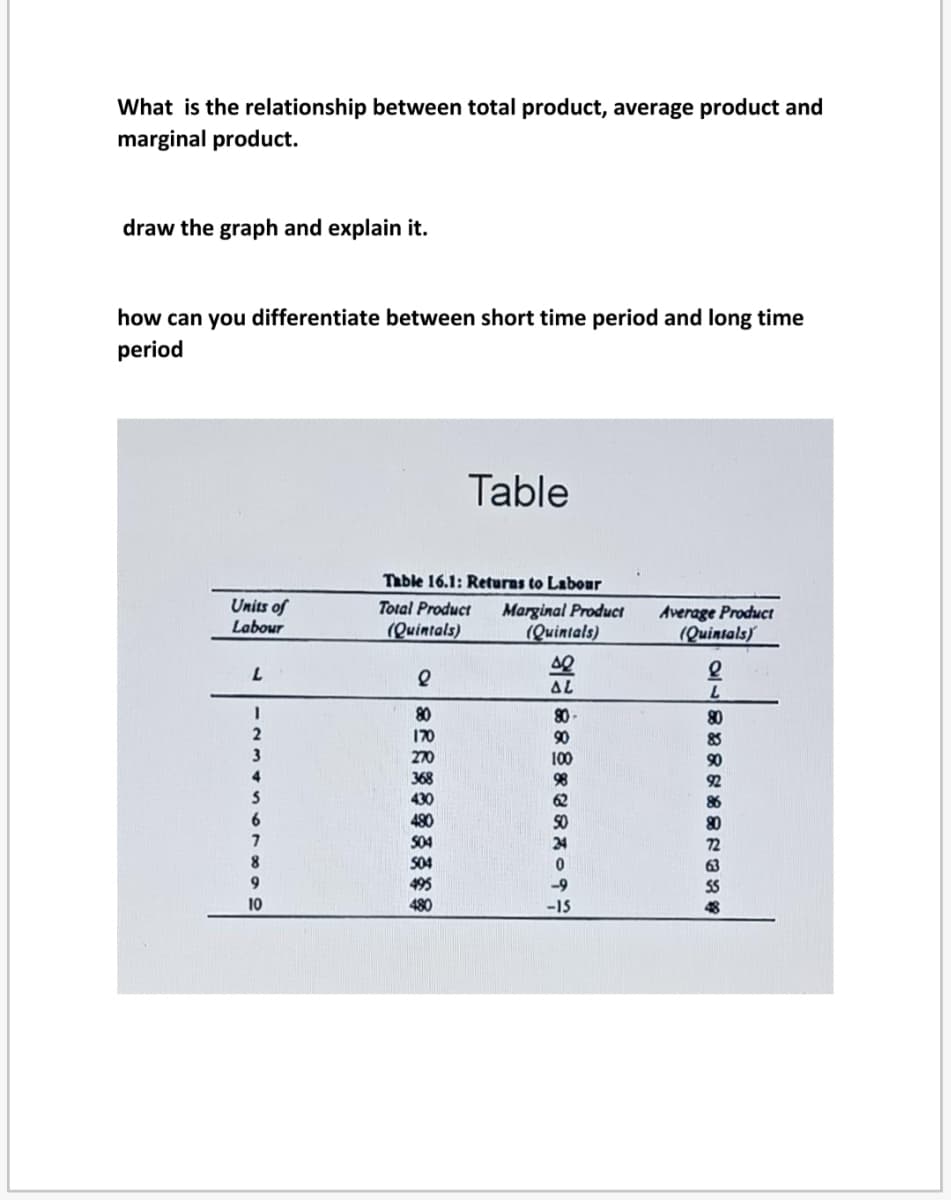
Transcribed Image Text:What is the relationship between total product, average product and
marginal product.
draw the graph and explain it.
how can you differentiate between short time period and long time
period
Table
Table 16.1: Returns to Labour
Units of
Labour
Total Product
Marginal Product
(Quintals)
Average Product
(Quintals)
(Quintals)
AL
7.
80
80 -
80
170
90
100
83
90
3
270
4
368
430
480
92
86
6.
80
7
S04
72
S04
63
9.
495
480
10
-15
Expert Solution
This question has been solved!
Explore an expertly crafted, step-by-step solution for a thorough understanding of key concepts.

Step by step
Solved in 2 steps with 2 images

Knowledge Booster


Learn more about
Need a deep-dive on the concept behind this application? Look no further. Learn more about this topic, economics and related others by exploring similar questions and additional content below.Recommended textbooks for you
Principles of Economics 2e
Economics
ISBN:
9781947172364
Author:
Steven A. Greenlaw; David Shapiro
Publisher:
OpenStax


Principles of Economics 2e
Economics
ISBN:
9781947172364
Author:
Steven A. Greenlaw; David Shapiro
Publisher:
OpenStax


Economics (MindTap Course List)
Economics
ISBN:
9781337617383
Author:
Roger A. Arnold
Publisher:
Cengage Learning