Complete the following table by calculating marginal product and average product. Instructions: Enter your answers as a whole number. Inputs of Labor Marginal Product Average Product Total Product 1 15 34 51 4. 64 75 84 91 8 96 3.
Complete the following table by calculating marginal product and average product. Instructions: Enter your answers as a whole number. Inputs of Labor Marginal Product Average Product Total Product 1 15 34 51 4. 64 75 84 91 8 96 3.

Chapter7: Production And Cost In The Firm
Section: Chapter Questions
Problem 3.7P

Related questions
Question
Question 3
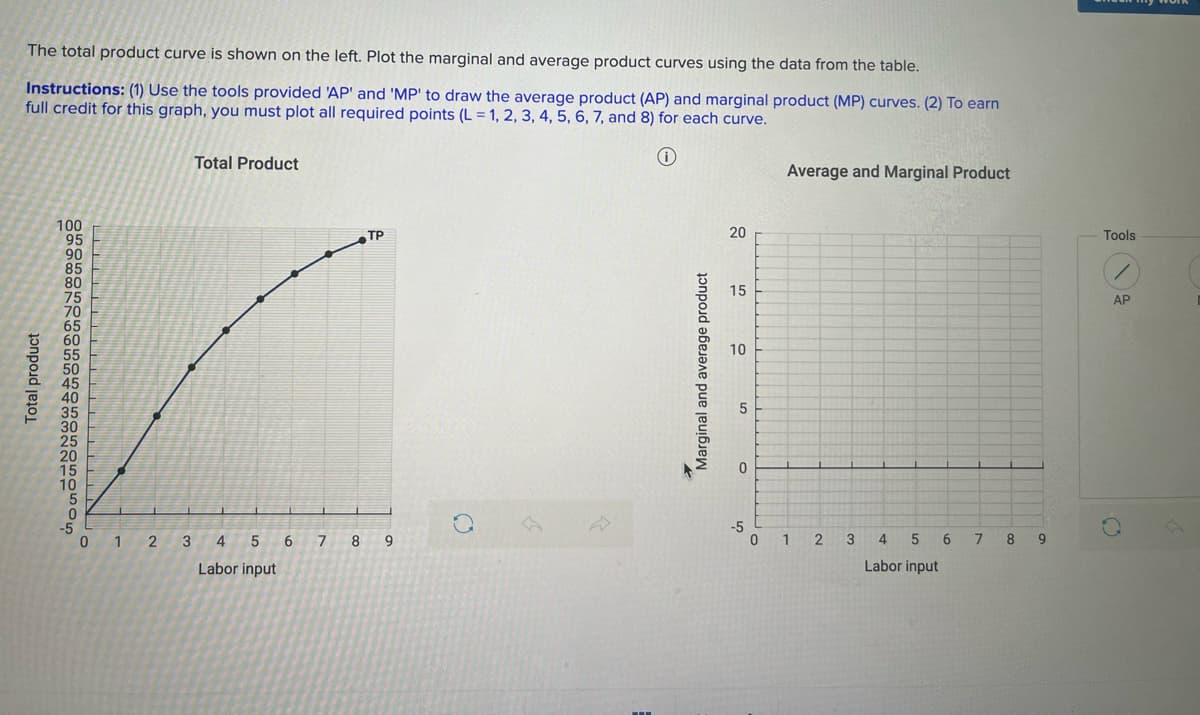
Transcribed Image Text:The total product curve is shown on the left. Plot the marginal and average product curves using the data from the table.
Instructions: (1) Use the tools provided 'AP' and 'MP' to draw the average product (AP) and marginal product (MP) curves. (2) To earn
full credit for this graph, you must plot all required points (L = 1, 2, 3, 4, 5, 6, 7, and 8) for each curve.
Total Product
Average and Marginal Product
100
95
90
85
80
75
70
65
60
TP
20
Tools
15
AP
10
45
40
35
15
10
5
-5
0 1 2 3 4 5 6 7 8 9
-5
1 2 3
4
5 6
8
9.
Labor input
Labor input
Total product
Marginal and average product
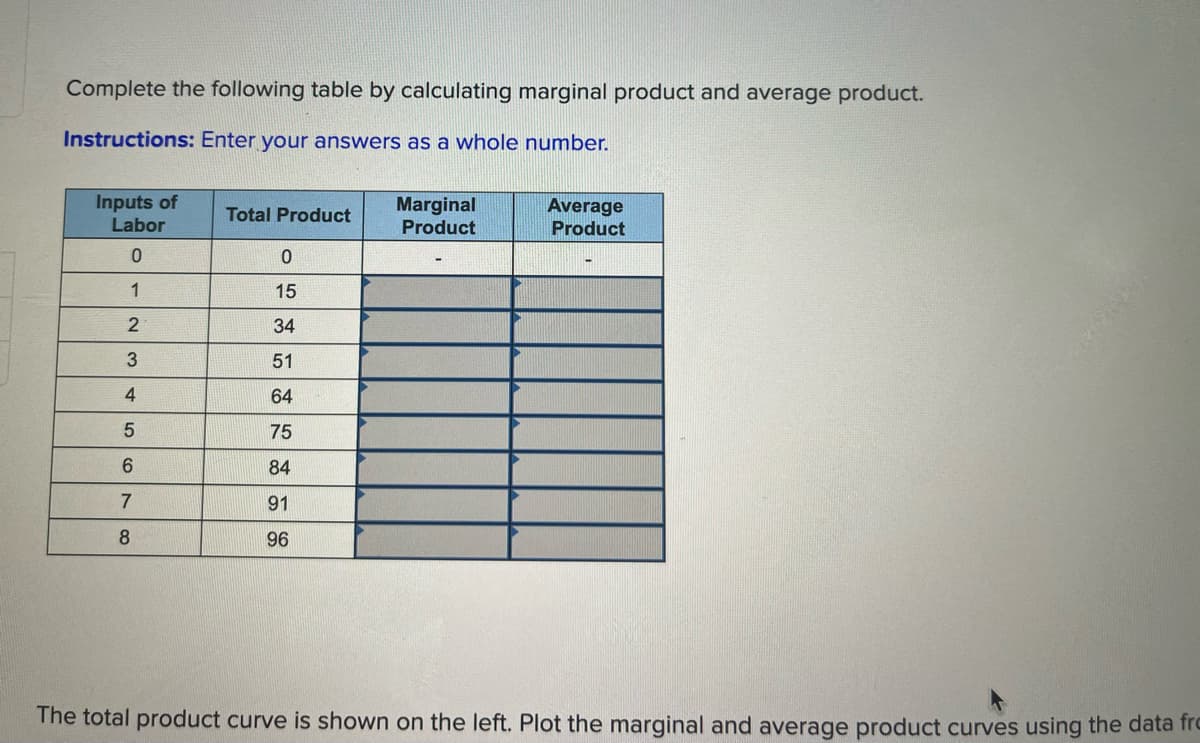
Transcribed Image Text:Complete the following table by calculating marginal product and average product.
Instructions: Enter your answers as a whole number.
Inputs of
Labor
Marginal
Product
Average
Product
Total Product
1
15
34
51
4.
64
75
84
91
8
96
The total product curve is shown on the left. Plot the marginal and average product curves using the data fro
Expert Solution
This question has been solved!
Explore an expertly crafted, step-by-step solution for a thorough understanding of key concepts.

This is a popular solution!

Trending now
This is a popular solution!

Step by step
Solved in 2 steps with 1 images

Knowledge Booster


Learn more about
Need a deep-dive on the concept behind this application? Look no further. Learn more about this topic, economics and related others by exploring similar questions and additional content below.Recommended textbooks for you


Essentials of Economics (MindTap Course List)
Economics
ISBN:
9781337091992
Author:
N. Gregory Mankiw
Publisher:
Cengage Learning

Principles of Economics 2e
Economics
ISBN:
9781947172364
Author:
Steven A. Greenlaw; David Shapiro
Publisher:
OpenStax

Exploring Economics
Economics
ISBN:
9781544336329
Author:
Robert L. Sexton
Publisher:
SAGE Publications, Inc