What is the standard error estimate State H0 and H1 What’s the p value Did you reject H0
What is the standard error estimate State H0 and H1 What’s the p value Did you reject H0

Algebra & Trigonometry with Analytic Geometry
13th Edition
ISBN:9781133382119
Author:Swokowski
Publisher:Swokowski
Chapter4: Polynomial And Rational Functions
Section4.6: Variation
Problem 4E

Related questions
Question
Price (cents)
59
59
59
59
59
79
59
79
79
79
79
79
99
99
99
99
99
99
Promotional expenses
200
200
400
400
600
200
500
200
200
400
800
600
200
400
200
400
800
600
Sales number
3842
3519
4630
3754
5120
1916
5015
3636
2295
2618
4113
3532
1096
2088
2114
2159
3354
2927
What is the standard error estimate
State H0 and H1
What’s the p value
Did you reject H0
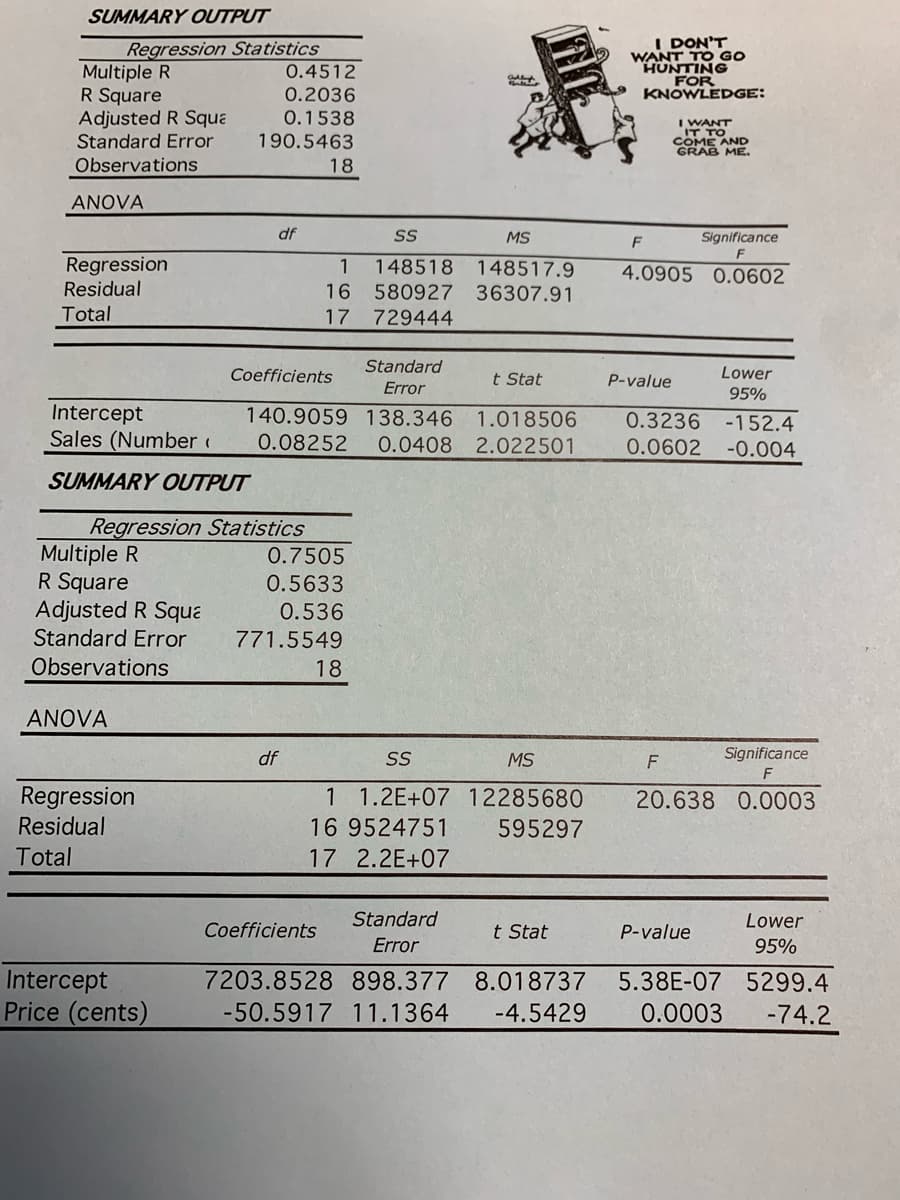
Transcribed Image Text:SUMMARY OUTPUT
Regression Statistics
Multiple R
R Square
Adjusted R Squa
Standard Error
I DON'T
WANT TO GO
HUNTING
FOR
KNOWLEDGE:
0.4512
0.2036
0.1538
190.5463
I WANT
IT TO
COME AND
GRAB ME.
Observations
18
ANOVA
df
SS
MS
F
Significance
Regression
Residual
Total
148518 148517.9
580927 36307.91
1
4.0905 0.0602
16
17
729444
Coefficients
Standard
t Stat
Lower
P-value
Error
95%
Intercept
Sales (Number
140.9059 138.346
1.018506
0.3236 -152.4
0.08252
0.0408
2.022501
0.0602
-0.004
SUMMARY OUTPUT
Regression Statistics
Multiple R
R Square
Adjusted R Squa
Standard Error
0.7505
0.5633
0.536
771.5549
Observations
18
ANOVA
df
SS
MS
F
Significance
Regression
Residual
1 1.2E+07 12285680
20.638 0.0003
16 9524751
595297
Total
17 2.2E+07
Standard
Lower
Coefficients
t Stat
P-value
Error
95%
Intercept
Price (cents)
7203.8528 898.377
8.018737
5.38E-07 5299.4
-50.5917 11.1364
-4.5429
0.0003
-74.2
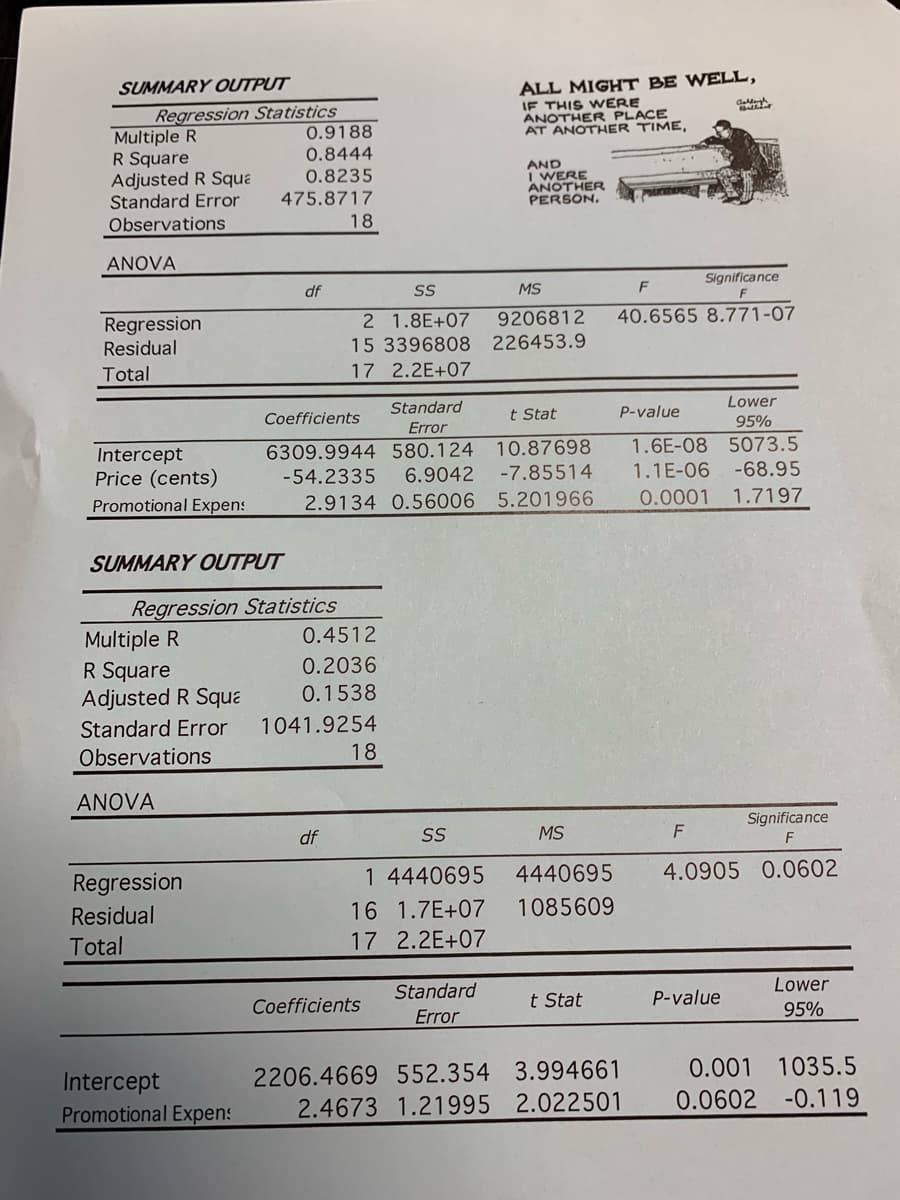
Transcribed Image Text:ALL MIGHT BE WELL,
IF THIS WERE
ANOTHER PLACE
AT ANOTHER TIME,
SUMMARY OUTPUT
Regression Statistics
Multiple R
R Square
Adjusted R Squa
Standard Error
Observations
0.9188
0.8444
0.8235
475.8717
AND
I WERE
ANOTHER
PERSON.
18
ANOVA
Significance
df
SS
MS
F
2 1.8E+07
9206812
40.6565 8.771-07
Regression
Residual
15 3396808 226453.9
Total
17 2.2E+07
Lower
Standard
t Stat
P-value
Coefficients
95%
Error
10.87698
-7.85514
1.6E-08 5073.5
-68.95
6309.9944 580.124
Intercept
Price (cents)
-54.2335
6.9042
1.1E-06
Promotional Expens
2.9134 0.56006
5.201966
0.0001 1.7197
SUMMARY OUTPUT
Regression Statistics
Multiple R
R Square
Adjusted R Squa
0.4512
0.2036
0.1538
Standard Error
Observations
1041.9254
18
ANOVA
Significance
df
SS
MS
1 4440695
4440695
4.0905 0.0602
Regression
Residual
16 1.7E+07
1085609
Total
17 2.2E+07
Standard
Lower
Coefficients
t Stat
P-value
95%
Error
2206.4669 552.354 3.994661
2.4673 1.21995 2.022501
0.001 1035.5
Intercept
Promotional Expens
0.0602 -0.119
Expert Solution
This question has been solved!
Explore an expertly crafted, step-by-step solution for a thorough understanding of key concepts.

Step by step
Solved in 2 steps with 2 images

Recommended textbooks for you
Algebra & Trigonometry with Analytic Geometry
Algebra
ISBN:
9781133382119
Author:
Swokowski
Publisher:
Cengage

Glencoe Algebra 1, Student Edition, 9780079039897…
Algebra
ISBN:
9780079039897
Author:
Carter
Publisher:
McGraw Hill
Algebra & Trigonometry with Analytic Geometry
Algebra
ISBN:
9781133382119
Author:
Swokowski
Publisher:
Cengage
Glencoe Algebra 1, Student Edition, 9780079039897…
Algebra
ISBN:
9780079039897
Author:
Carter
Publisher:
McGraw Hill