What is the value of r2? Use the square root and your knowledge about the slope of the regression line to find the value of the correlation constant r. Based only on the value of r, do you think this line is useful for predicting life expectancy from the infant mortality rate?
What is the value of r2? Use the square root and your knowledge about the slope of the regression line to find the value of the correlation constant r. Based only on the value of r, do you think this line is useful for predicting life expectancy from the infant mortality rate?

Algebra & Trigonometry with Analytic Geometry
13th Edition
ISBN:9781133382119
Author:Swokowski
Publisher:Swokowski
Chapter5: Inverse, Exponential, And Logarithmic Functions
Section5.6: Exponential And Logarithmic Equations
Problem 7E

Related questions
Question
100%
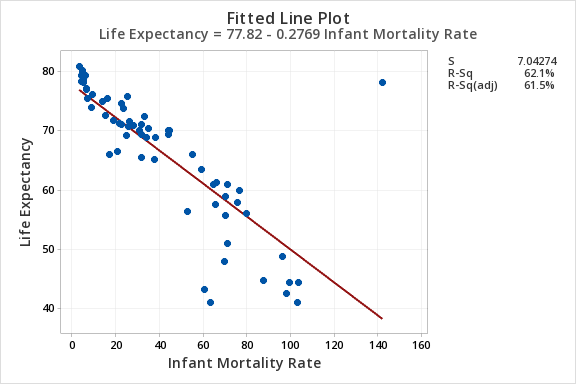
- What is the value of r2?
- Use the square root and your knowledge about the slope of the regression line to find the value of the
correlation constant r. - Based only on the value of r, do you think this line is useful for predicting life expectancy from the infant mortality rate?
- A new country called Arendelle has formed and has an infant mortality rate of 42 (deaths per 1000 live births). Use the equation of the regression line to predict the life expectancy for Arendelle. Round your answer to one decimal place.
- Another new country called Weselton has formed and has an infant mortality rate of 250 (deaths per 1000 live births). Recall some of the cautions we should take when considering correlation. In one or two complete sentences, explain why using the linear regression equation to make a life expectancy prediction is not a good idea for Weselton.
- If you had to choose exactly one potential influential outlier from the original data set, what would it be? Identify the point as an ordered pair (x,y).
- What is the new value of the correlation constant r?
- Based on the value of r and/or the fit of the regression line, is the new regression line a better predictor for a country’s life expectancy? Explain, using 2 or more complete sentences
Transcribed Image Text:Life Expectancy
80
70
50
40
0
Fitted Line Plot
Life Expectancy = 77.82 - 0.2769 Infant Mortality Rate
20
40
60
80 100
Infant Mortality Rate
120
140
160
S
R-Sq
R-Sq(adj)
7.04274
62.1%
61.5%
Expert Solution
This question has been solved!
Explore an expertly crafted, step-by-step solution for a thorough understanding of key concepts.

Step by step
Solved in 2 steps

Recommended textbooks for you
Algebra & Trigonometry with Analytic Geometry
Algebra
ISBN:
9781133382119
Author:
Swokowski
Publisher:
Cengage

Glencoe Algebra 1, Student Edition, 9780079039897…
Algebra
ISBN:
9780079039897
Author:
Carter
Publisher:
McGraw Hill

College Algebra
Algebra
ISBN:
9781305115545
Author:
James Stewart, Lothar Redlin, Saleem Watson
Publisher:
Cengage Learning
Algebra & Trigonometry with Analytic Geometry
Algebra
ISBN:
9781133382119
Author:
Swokowski
Publisher:
Cengage
Glencoe Algebra 1, Student Edition, 9780079039897…
Algebra
ISBN:
9780079039897
Author:
Carter
Publisher:
McGraw Hill
College Algebra
Algebra
ISBN:
9781305115545
Author:
James Stewart, Lothar Redlin, Saleem Watson
Publisher:
Cengage Learning

Functions and Change: A Modeling Approach to Coll…
Algebra
ISBN:
9781337111348
Author:
Bruce Crauder, Benny Evans, Alan Noell
Publisher:
Cengage Learning