What is the value of t in year 2014 ? (Recall that t is the number of years after 1995) Estimate the retails sales in the U. S. in 2014. billions of dollars. (Use the equation F(t)above and estimate to the nearest whole number) Use the model to predict the year in which retails sales will be $233 billion.


Transformation of Graphs
The word ‘transformation’ means modification. Transformation of the graph of a function is a process by which we modify or change the original graph and make a new graph.
Exponential Functions
The exponential function is a type of mathematical function which is used in real-world contexts. It helps to find out the exponential decay model or exponential growth model, in mathematical models. In this topic, we will understand descriptive rules, concepts, structures, graphs, interpreter series, work formulas, and examples of functions involving exponents.
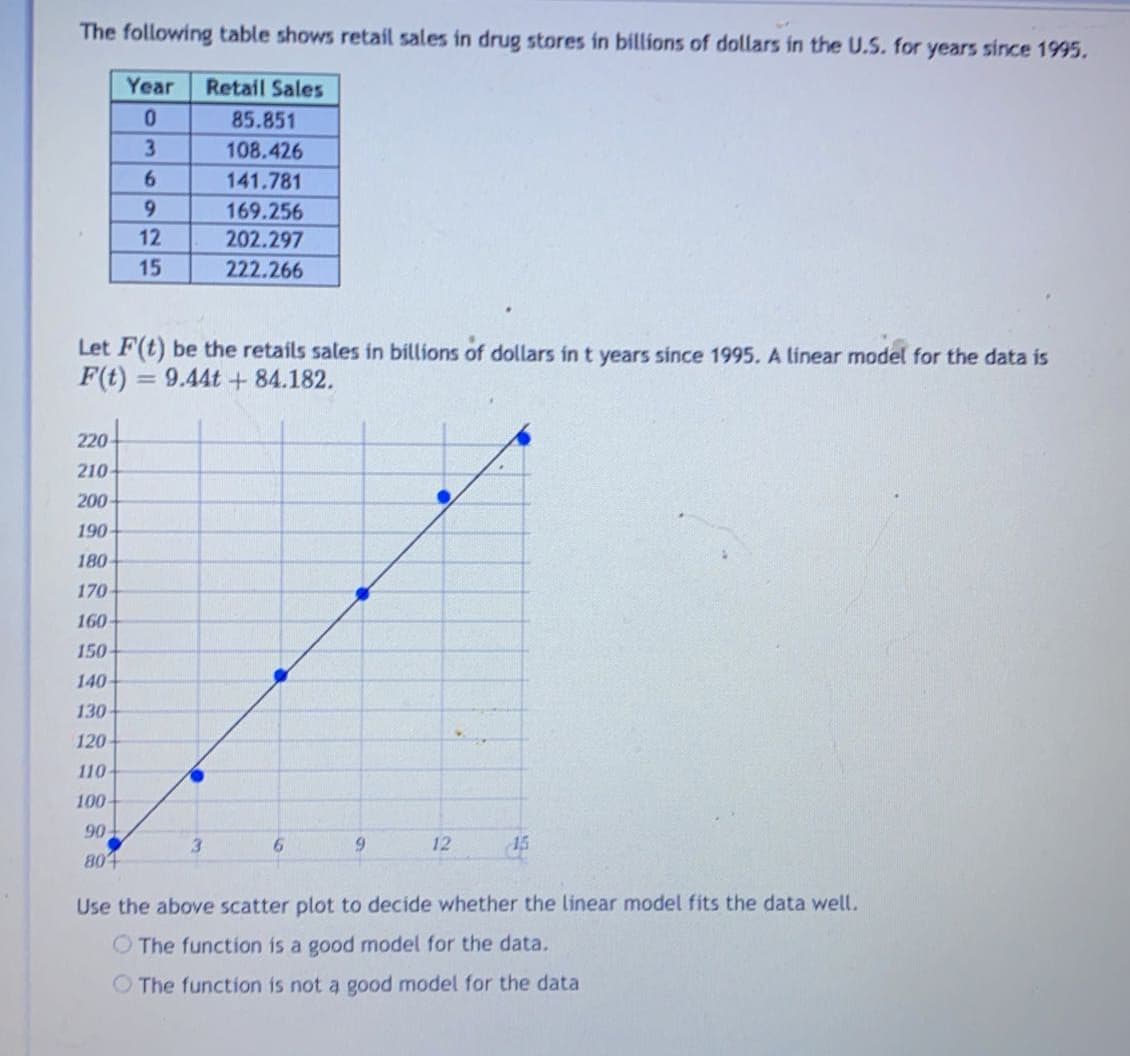
What is the value of t in year 2014 ?
(Recall that t is the number of years after 1995)
Estimate the retails sales in the U. S. in 2014. billions of dollars.
(Use the equation F(t)above and estimate to the nearest whole number)
Use the model to predict the year in which retails sales will be $233 billion.

Step by step
Solved in 3 steps


