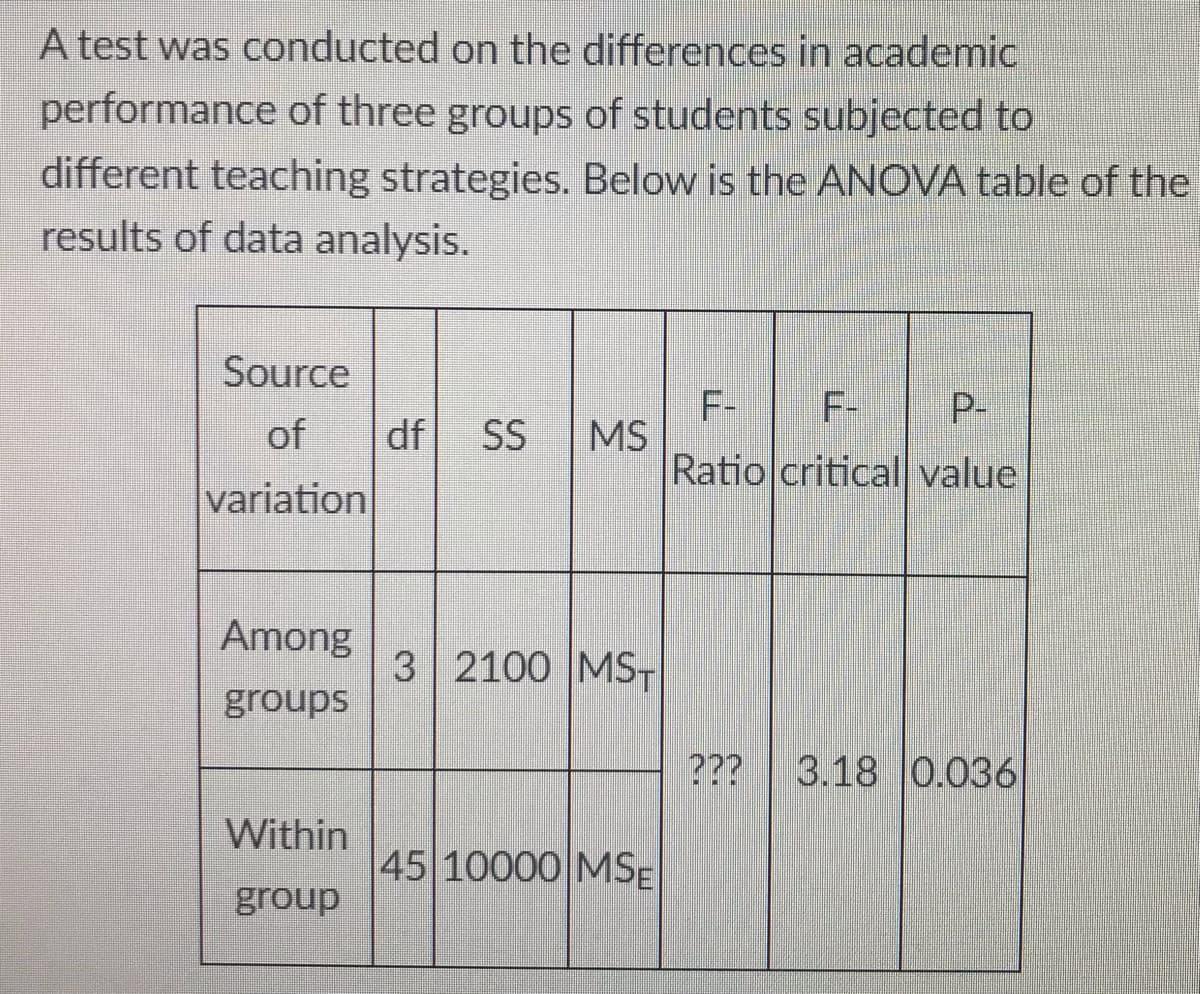
What is the value of the mean square for treatment? O 348.53 O None of the Choices O 34.64 O 700 O 23.53


Q: Considering a c chart with LCL=0.513 & UCL=19.487, what is the probability of NOT detecting the mean…
A: Given that
Q: n a set of score, the coefficient of variation (in percentage terms) = 50% and standard deviation =…
A: The coefficient of variation is the ratio of the standard deviation to the mean. It is a measure of…
Q: Which of the following is a measure of risk? O None of the listed choices is correct O T-statistic O…
A: which one is the measure of risk 1); T statistic 2): mode 3): skewness 4): standard deviations
Q: How many TV sets? A survey organization sampled 53 households in a community and found that the…
A:
Q: 3) Find the mean, standard deviation, and the five-number summary for the following (use a…
A: Given a data : X= 2,4,7,8,12,13,13,16,23,23,25,26,27,27,38,39,47,55 We have to calculate the mean…
Q: What does the z-score of a data point tell us? O How many standard deviation a number is from the…
A: Here we have to identify the correct statement
Q: (e) Compute three measures of central tendency. Which measure is the most appropriate for this data…
A: Introduction: It is required to calculate three measures of central tendency, and the standard…
Q: Given the histogram and descriptive statistics of the image below, describe the shape, and wihat…
A: Given : Mean = μ = 8.44 Median = 7.09 Standard deviation = σ = 2.47 Sample size = n = 500
Q: Which pair of quantities below consists of two measures of dispersion? O a. Median and Mean O b.…
A: In statistics the measure of dispersion help to interpret the variability of data. The types of…
Q: Q15 The mean deviation of the set ( 2, 5, 5, 8, 12) is
A: Note: Please repost 2nd question as i can author only 1 question as per my policy. Q15) Given data…
Q: 21. Which set of scores below has the smallest standard deviation? а. 11, 17, 31, 53 b. 5, 11, 42,…
A:
Q: The lengths (in minutes) of a random selection of popular children's animated films are listed…
A: Given that The lengths of random selection of children's animated films are listed below. 90 84…
Q: __ is a measure of speed and describes the difference between the mean and random variable? a.…
A: In this case, one needs to fill the suitable answer.
Q: Find the mean, median, and mode of the data, if possible. If any of these measures cannot be found…
A:
Q: What is the average score for those who are able to speak up for themselves with the standard…
A:
Q: 6. Which set of scores has the smallest standard deviation? Note: you shouldn't have to calculate…
A: by observing the above data the set of score have smallest standard deviation is c)…
Q: Determine the correct alternative hypothesis. According to the Federal Housing Finance Board, the…
A:
Q: The mean and standard deviation of a population are 200 and 20, respectively. What is the…
A: Answer - The mean and standard deviation of a population are μ = 200 and σ = 20…
Q: The time spent by a teacher at work in the holidays is normally distributed with a mean of 20 hours…
A: X: time spent by a teacher at work in the holidaysX~N(μ,σ)Mean(μ)=20 hoursstandard deviation(σ)=5…
Q: Which of the following descriptive considered as a statistic? 14. measure is A. N В. X С. и D. o
A: 14Here, we have given the question about the descriptive measure which can be considered a…
Q: What does the Z score measure? Choose the correct answer below. O A. The skewness of a distribution…
A: GivenThe z score measures
Q: 2 The number of text messages that Isaac received each day for a week is s. 8, 47, 55. Vhat is the…
A:
Q: What's the population standard deviation s? O= O1 O 2
A:
Q: 12. It is the square of the population standard deviation. Answer:
A: ( 12 ) It is the square of the population standard deviation .
Q: Water pipe to be used in certain application is required to have a mean breaking strength of more…
A: Here Given for water pipe used in certain application Hypothesis H0 : μ= 2000 Ha: μ > 2000
Q: Look again at the choir teacher's summary of attendance Number of learners at choir practice 3)…
A: To find: The approximate value of the mean number of learners who attend choir practice
Q: In a particular examination, the mean score is 82 and the standard deviation is 3.7. What is the Z-…
A:
Q: 18. Which of the following measures describes how spread out the data is from the mean? O median O…
A: To determine which of the following measures describes how spread out the data is from the mean.1…
Q: The within group mean square is derived by using A. SSTR divided by SSE. B. SSTR divided by degrees…
A: Since you have asked multiple question, we will solve the first question for you. If you want any…
Q: For a repeated measures design t statistic, n = 9, Md =4.90, SS = 72. What is the estimated standard…
A: According to the provided information, n = 9, Md =4.90, SS = 72.
Q: The ages (in years) of 28 students selected from a local university are given below. Use the data to…
A: ANSWER:- a) Mean = Sum of terms/Number of terms = 647/28 Mean=23.1071 b) b)
Q: What does df denote? O A. The sample size O B. The test statistic OC. The number of degrees of…
A: Given : A test is being performed for checking the claim that population mean is greater than 71 sec…
Q: 3.1 Question: Which of the following commands calculates the mean in Excel? O =MEAN O =AVERAGE
A:
Q: During a weight loss study, each of eight subjects were given a diet for 4 months. Use the table,…
A: Given, Difference -17 -17 -17 -18 -15 -18 -14 -21 -17.13 2.10 The mean of the difference is…
Q: You are given n = 5 measurements 2, 1, 1, 3, 5. Find the sample standard deviation
A: Given data : 2,1,1,3,5
Q: Find the population standard deviation for the following ten values. Also find coefficient of…
A: Standard deviations and coefficient of variation
Q: The school board wants to determine how many school days should be designated as snow days. The…
A: Solution
Q: An Excel assignment counts for 0-10 points. The scores in a class of 12 students are recorded as…
A: Use the given data to form the excel table: Scores x-x x-x2 1 -6 36…
Q: Babies: According to a recent report, a sample of 300 one-year-old baby boys in the United States…
A: Explanation:in this the answer is should In step2 the clearly writed
Q: (c) After you obtain your ten observations, you compute the mean number of hours of sleep. Is this a…
A: Solution: It is given that you obtain a list of full-time students at your college, obtain a simple…
Q: What is the average score for those who work well with others in teams with the standard deviation?
A:
Q: The amount of time (in minutes) that a sample of students spends watching television per day is…
A: Hello! As you have posted more than 3 sub parts, we are answering the first 3 sub-parts. In case…
Q: n = 101. What is the mean of the distribution of sample means? What is the standard deviation of the…
A:
Q: e) Estimate the following statistical measures 1. Mean2. Median 3. Mode
A: Given, the frequency table for daily sales 100 sale unit. 1). The mean of the following data is…
Q: I measure age using the following response options: a. 18-28, b. 29-39, c. 40-50, d. 51+ I should…
A: Introduction :- Given :- We have to decide which of following discriptive statistics is useful to…
Q: 4. Base on the graphical representation you made, illustrate for the following: a. mean or expected…
A: We need to find mean , variance and standard deviation
Q: Consider the data: 12, 9, 11, 15, 13, 15, 16. (Show your work.) a) Determine the mean. b)…
A: To determine, Mean Median Standard Deviation Given data: n=7
Q: Use the data set to answer the following. 4 7 2 4 5 1 8 (a) Determine the mean. (b) Determine the…
A: Solution: Note: Hello! As you have posted more than 3 sub parts, we are answering the first 3…
Q: find the mean and standard deviation for A B C Sample a: 12. 21.30 Sample b: 70, 79,88 Sample…
A: Given information- We have given 3 samples. Sample a, sample b, sample c. We have to find the mean…

Step by step
Solved in 2 steps

- What is meant by the sample space of an experiment?The result of an One-Way ANOVA for total stress symptoms among four groups of teachers (pre-k, elementary, middle, high school) was F(3, 117) = 3.827, p < .05. The corresponding effect size was η2 = .26. What can be concluded about these results?What source of variation is found in an ANOVA summary table for a within subjects design that is not in an ANOVA summary table for a between subjects design. What happens to this source of variation in a between-subjects design?
- A case-control (or retrospective) study was conducted to investigate a relationship between the colors of helmets worn by motorcycle drivers and whether they are injured or killed in a crash. Results are given in the accompanying table. Using a 0.05 significance level, test the claim that injuries are independent of helmet color.A recent study on driving behavior examined whether the combination of high driving skills and low safety skills is dangerous. Participants were classified as high or low in driving skill based on responses to a driver-skill inventory, then classified as high or low in safety skill based on responses to a driver-aggression scale. An overall measure of driving risk was obtained by combining several variables such as number of accidents, tickets, tendency to speed, etc. The following data were obtained. Use a 2 x 2 ANOVA with the .05 significance level to evaluate the results. What cutoff score(s) should be used? Driving Skill Low High Safety Skill Low M1=5 M2=4.5 S1=2.7 S2=3.8 N1=6 N2=6 HIgh M3=3 M4=3.5 S3=2.9 S4=2.5 N3=6 N4=6 Group of answer choices +4.35 +3.40 +3.49 +4.26A recent study on driving behavior examined whether the combination of high driving skills and low safety skills is dangerous. Participants were classified as high or low in driving skill based on responses to a driver-skill inventory, then classified as high or low in safety skill based on responses to a driver-aggression scale. An overall measure of driving risk was obtained by combining several variables such as number of accidents, tickets, tendency to speed, etc. The following data were obtained. Use a 2 x 2 ANOVA with the .05 significance level to evaluate the results. Which of the following is one of the research hypotheses? Driving Skill Low High Safety Skill Low M1=5 M2=4.5 S1=2.7 S2=3.8 N1=6 N2=6 HIgh M3=3 M4=3.5 S3=2.9 S4=2.5 N3=6 N4=6 Group of answer choices The difference in driving risk between drivers with high and low driving safety does not depend on driving skill level On average, drivers classified as high and low in safety skill do not…
- If there is an overall significant F in a one way ANOVA, can we conclude that the group membership or treatment variable caused the observed differences in the group means? Why or Why not?Does St. John wort (an herb) have a siginifact effect in treating major depression? A study looked at 340 adult outpatients suffering as measured by their HAM-Dscore, randomly assiging each subject to either a placebo, St.John's wort, or a second active treatment for comparison. The study found the diiference in treating major depression as measured by improvement in HAM-D scores between St.John's wort and the placebo was not statistically significant This means that: A. a difference this big could easily occur just by chance even if St. John's wort does not better than the placebo B. We cannot make a 95 percent confidence statement C.The placebo makes no difference in the subjects' depression D. The study was badly designedA researcher was interested in whether there were differences in the level of activity in children who had been diagnosed with ADHA depending on whether they had received no treatment, were on Ritalin, or were in a behavior management program. He recruited 90 children with ADHD to participate, and randomly assigned each child to one of the three groups. The number of classroom disturbances during a 1 hour period was measured for each child. Which statistical test would be best to determine if there is a significant difference between groups? one-sample t-test dependent samples t-test independent samples t-test ANOVA
- A researcher was interested in whether there were differences in the level of activity in children who had been diagnosed with ADHA depending on whether they had received no treatment, were on Ritalin, or were in a behavior management program. He recruited 90 children with ADHD to participate, and randomly assigned each child to one of the three groups. The number of classroom disturbances during a 1 hour period was measured for each child. Which statistical test would be best to determine if there is a significant difference between groups? one-sample t-test dependent samples t-test ANOVAA newspaper published an article about a study in which researchers subjected laboratory gloves to stress. Among 228 vinyl gloves, 57% leaked viruses. Among 228 latex gloves, 11% leaked viruses. Using the accompanying display of the technology results, and using a 0.10 significance level, test the claim that vinyl gloves have a greater virus leak rate than latex gloves. Let vinyl gloves be population 1. Pooled proportion: 0.34 Test statistic, z: 10.5783 Critical z: 1.2816 P-value: 0.0000 80% Confidence interval: 0.4199096<p1−p2< 0.5186869 Identify the test statistic. Identify the P-value.Use an ANOVA with α = .05 to determine whether there are any significant differences among the three treatment means.