Please use the accompanying Excel data set or accompanying Text file data set when completing the following exercise. An article in the Journal of Aircraft (1986, Vol. 23, pp. 859-864) described a new equivalent plate analysis method formulation that is capable of modeling aircraft structures such as cranked wing boxes and that produces results similar to the more computationally intensive finite element analysis method. Natural vibration frequencies for the cranked wing box structure are calculated using both methods, and results for the first seven natural frequencies follow: Frequency Finite Element, Cycle/s Equivalent Plate, Cycle/s 1 14.58 14.76 2 3 4 5 6 48.52 97.22 113.99 174.73 212.72 277.38 49.10 99.97 117.53 181.22 220.14 294.80 Use only Table V of Appendix A. (a) Do the data suggest that the two methods provide the same mean value for natural vibration frequency? Find interval for P-value: 0.025 < P-value < 0.05 Conclusion: For a significance level of a 0.05, we would reject the null hypothesis. There is evidence to conclude that the two methods provide different mean values for natural vibration frequency. (b) Find a 95% confidence interval on the mean difference between the two methods and use it to answer the question in part (a). Round your answer to 3 decimal places. -10.962 ≤ HD ≤ -0.001 Conclusion: Does the confidence interval indicate that the two methods provide different mean values for natural vibration frequency? sufficient
Please use the accompanying Excel data set or accompanying Text file data set when completing the following exercise. An article in the Journal of Aircraft (1986, Vol. 23, pp. 859-864) described a new equivalent plate analysis method formulation that is capable of modeling aircraft structures such as cranked wing boxes and that produces results similar to the more computationally intensive finite element analysis method. Natural vibration frequencies for the cranked wing box structure are calculated using both methods, and results for the first seven natural frequencies follow: Frequency Finite Element, Cycle/s Equivalent Plate, Cycle/s 1 14.58 14.76 2 3 4 5 6 48.52 97.22 113.99 174.73 212.72 277.38 49.10 99.97 117.53 181.22 220.14 294.80 Use only Table V of Appendix A. (a) Do the data suggest that the two methods provide the same mean value for natural vibration frequency? Find interval for P-value: 0.025 < P-value < 0.05 Conclusion: For a significance level of a 0.05, we would reject the null hypothesis. There is evidence to conclude that the two methods provide different mean values for natural vibration frequency. (b) Find a 95% confidence interval on the mean difference between the two methods and use it to answer the question in part (a). Round your answer to 3 decimal places. -10.962 ≤ HD ≤ -0.001 Conclusion: Does the confidence interval indicate that the two methods provide different mean values for natural vibration frequency? sufficient

MATLAB: An Introduction with Applications
6th Edition
ISBN:9781119256830
Author:Amos Gilat
Publisher:Amos Gilat
Chapter1: Starting With Matlab
Section: Chapter Questions
Problem 1P

Related questions
Question
Q-(2)
Transcribed Image Text:Your answer is partially correct.
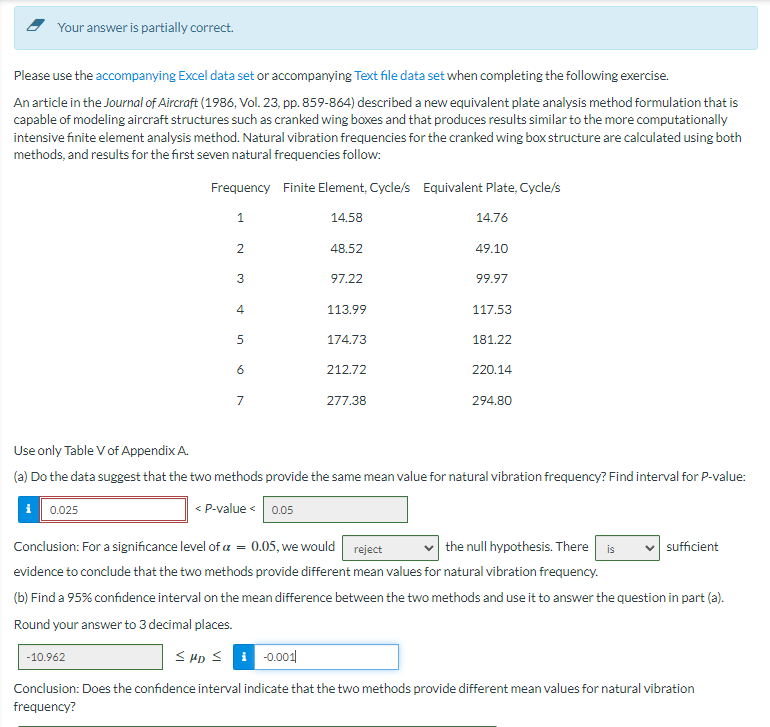
Please use the accompanying Excel data set or accompanying Text file data set when completing the following exercise.
An article in the Journal of Aircraft (1986, Vol. 23, pp. 859-864) described a new equivalent plate analysis method formulation that is
capable of modeling aircraft structures such as cranked wing boxes and that produces results similar to the more computationally
intensive finite element analysis method. Natural vibration frequencies for the cranked wing box structure are calculated using both
methods, and results for the first seven natural frequencies follow:
Frequency Finite Element, Cycle/s Equivalent Plate, Cycle/s
1
2
3
4
5
6
7
14.58
48.52
97.22
113.99
174.73
212.72
277.38
14.76
49.10
99.97
117.53
181.22
220.14
294.80
Use only Table V of Appendix A.
(a) Do the data suggest that the two methods provide the same mean value for natural vibration frequency? Find interval for P-value:
i 0.025
< P-value < 0.05
Conclusion: For a significance level of a = 0.05, we would reject
the null hypothesis. There is
evidence to conclude that the two methods provide different mean values for natural vibration frequency.
(b) Find a 95% confidence interval on the mean difference between the two methods and use it to answer the question in part (a).
Round your answer to 3 decimal places.
-10.962
≤ HD ≤
-0.001
Conclusion: Does the confidence interval indicate that the two methods provide different mean values for natural vibration
frequency?
sufficient
Expert Solution
This question has been solved!
Explore an expertly crafted, step-by-step solution for a thorough understanding of key concepts.

This is a popular solution!

Trending now
This is a popular solution!

Step by step
Solved in 6 steps

Follow-up Questions
Read through expert solutions to related follow-up questions below.
Follow-up Question
The accept boundaries for the P-value using a T chart as the question asks. Is
.02 <P<.05
Solution
Recommended textbooks for you
MATLAB: An Introduction with Applications
Statistics
ISBN:
9781119256830
Author:
Amos Gilat
Publisher:
John Wiley & Sons Inc

Probability and Statistics for Engineering and th…
Statistics
ISBN:
9781305251809
Author:
Jay L. Devore
Publisher:
Cengage Learning

Statistics for The Behavioral Sciences (MindTap C…
Statistics
ISBN:
9781305504912
Author:
Frederick J Gravetter, Larry B. Wallnau
Publisher:
Cengage Learning
MATLAB: An Introduction with Applications
Statistics
ISBN:
9781119256830
Author:
Amos Gilat
Publisher:
John Wiley & Sons Inc
Probability and Statistics for Engineering and th…
Statistics
ISBN:
9781305251809
Author:
Jay L. Devore
Publisher:
Cengage Learning
Statistics for The Behavioral Sciences (MindTap C…
Statistics
ISBN:
9781305504912
Author:
Frederick J Gravetter, Larry B. Wallnau
Publisher:
Cengage Learning

Elementary Statistics: Picturing the World (7th E…
Statistics
ISBN:
9780134683416
Author:
Ron Larson, Betsy Farber
Publisher:
PEARSON

The Basic Practice of Statistics
Statistics
ISBN:
9781319042578
Author:
David S. Moore, William I. Notz, Michael A. Fligner
Publisher:
W. H. Freeman

Introduction to the Practice of Statistics
Statistics
ISBN:
9781319013387
Author:
David S. Moore, George P. McCabe, Bruce A. Craig
Publisher:
W. H. Freeman