What method or sampling technique was used to conduct the experiment depicted in the graph(s)? (b) What do the data show
What method or sampling technique was used to conduct the experiment depicted in the graph(s)? (b) What do the data show

Linear Algebra: A Modern Introduction
4th Edition
ISBN:9781285463247
Author:David Poole
Publisher:David Poole
Chapter2: Systems Of Linear Equations
Section2.4: Applications
Problem 2EQ: 2. Suppose that in Example 2.27, 400 units of food A, 500 units of B, and 600 units of C are placed...

Related questions
Question
(a) What method or sampling technique was used to conduct the experiment depicted in the graph(s)? (b) What do the data show?
Transcribed Image Text:700
600
500
400
300
200
100
Fin
Muscle
Blood
Plasma
Body tissue
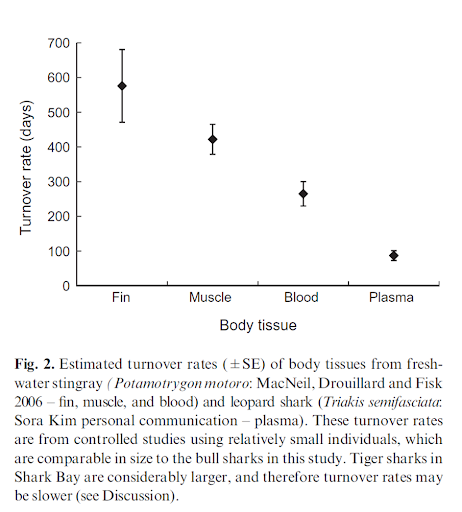
Fig. 2. Estimated turnover rates (+ SE) of body tissues from fresh-
water stingray (Potamotrygon motoro: MacNeil, Drouillard and Fisk
2006 – fin, muscle, and blood) and leopard shark (Triakis semifasciata.
Sora Kim personal communication – plasma). These turnover rates
are from controlled studies using relatively small individuals, which
are comparable in size to the bull sharks in this study. Tiger sharks in
Shark Bay are considerably larger, and therefore turnover rates may
be slower (see Discussion).
Turnover rate (days)
Expert Solution
This question has been solved!
Explore an expertly crafted, step-by-step solution for a thorough understanding of key concepts.

Step by step
Solved in 2 steps

Recommended textbooks for you
Linear Algebra: A Modern Introduction
Algebra
ISBN:
9781285463247
Author:
David Poole
Publisher:
Cengage Learning

Functions and Change: A Modeling Approach to Coll…
Algebra
ISBN:
9781337111348
Author:
Bruce Crauder, Benny Evans, Alan Noell
Publisher:
Cengage Learning
Linear Algebra: A Modern Introduction
Algebra
ISBN:
9781285463247
Author:
David Poole
Publisher:
Cengage Learning
Functions and Change: A Modeling Approach to Coll…
Algebra
ISBN:
9781337111348
Author:
Bruce Crauder, Benny Evans, Alan Noell
Publisher:
Cengage Learning