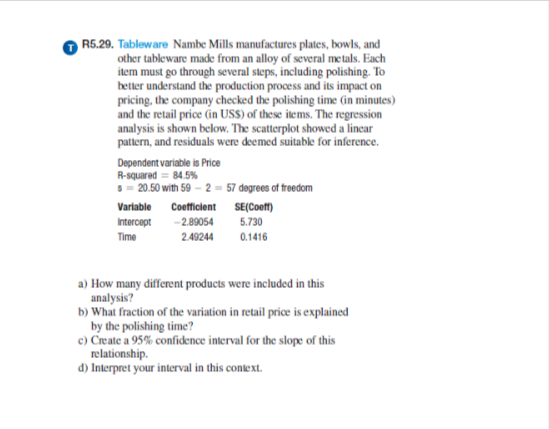
R5.29. Tableware Nambe Mills manufactures plates, bowls, and other tableware made from an alloy of several metals. Each item must go through several steps, including polishing. To better understand the production process and its impact on pricing, the company checked the polishing time (in minutes) and the retail price (in USS) of these items. The regression analysis is shown below. The scatterplot showed a linear pattern, and residuals were deemed suitable for inference. Dependent variable is Price R-squared= 84.5% s-20.50 with 59-2-57 degrees of freedom Variable Coefficient SE(Coeff) -2.89054 5.730 Intercept Time 2.49244 0.1416 a) How many different products were included in this analysis? b) What fraction of the variation in retail price is explained by the polishing time? c) Create a 95% confidence interval for the slope of this relationship. d) Interpret your interval in this context.
R5.29. Tableware Nambe Mills manufactures plates, bowls, and other tableware made from an alloy of several metals. Each item must go through several steps, including polishing. To better understand the production process and its impact on pricing, the company checked the polishing time (in minutes) and the retail price (in USS) of these items. The regression analysis is shown below. The scatterplot showed a linear pattern, and residuals were deemed suitable for inference. Dependent variable is Price R-squared= 84.5% s-20.50 with 59-2-57 degrees of freedom Variable Coefficient SE(Coeff) -2.89054 5.730 Intercept Time 2.49244 0.1416 a) How many different products were included in this analysis? b) What fraction of the variation in retail price is explained by the polishing time? c) Create a 95% confidence interval for the slope of this relationship. d) Interpret your interval in this context.

College Algebra
7th Edition
ISBN:9781305115545
Author:James Stewart, Lothar Redlin, Saleem Watson
Publisher:James Stewart, Lothar Redlin, Saleem Watson
Chapter1: Equations And Graphs
Section: Chapter Questions
Problem 10T: Olympic Pole Vault The graph in Figure 7 indicates that in recent years the winning Olympic men’s...

Related questions
Question
Transcribed Image Text:R5.29. Tableware Nambe Mills manufactures plates, bowls, and
other tableware made from an alloy of several metals. Each
item must go through several steps, including polishing. To
better understand the production process and its impact on
pricing, the company checked the polishing time (in minutes)
and the retail price (in USS) of these items. The regression
analysis is shown below. The scatterplot showed a linear
pattern, and residuals were deemed suitable for inference.
Dependent variable is Price
R-squared = 84.5%
s=20.50 with 59-2-57 degrees of freedom
Variable Coefficient SE(Coeff)
Intercept -2.89054
5.730
Time
2.49244
0.1416
a) How many different products were included in this
analysis?
b) What fraction of the variation in retail price is explained
by the polishing time?
c) Create a 95% confidence interval for the slope of this
relationship.
d) Interpret your interval in this context.
Expert Solution
This question has been solved!
Explore an expertly crafted, step-by-step solution for a thorough understanding of key concepts.

Step by step
Solved in 2 steps with 2 images

Recommended textbooks for you
College Algebra
Algebra
ISBN:
9781305115545
Author:
James Stewart, Lothar Redlin, Saleem Watson
Publisher:
Cengage Learning

Glencoe Algebra 1, Student Edition, 9780079039897…
Algebra
ISBN:
9780079039897
Author:
Carter
Publisher:
McGraw Hill
College Algebra
Algebra
ISBN:
9781305115545
Author:
James Stewart, Lothar Redlin, Saleem Watson
Publisher:
Cengage Learning
Glencoe Algebra 1, Student Edition, 9780079039897…
Algebra
ISBN:
9780079039897
Author:
Carter
Publisher:
McGraw Hill