What percent of IQ scores are less than 122? B. What is the probability that a randomly selected adult in this age group has an IQ score higher than 147? Is this a significant/unusual event? Explain. C. What percent of adults in this age group have IQs between 85 and 100? Is this significant/unusual event? Explain.
What percent of IQ scores are less than 122? B. What is the probability that a randomly selected adult in this age group has an IQ score higher than 147? Is this a significant/unusual event? Explain. C. What percent of adults in this age group have IQs between 85 and 100? Is this significant/unusual event? Explain.

MATLAB: An Introduction with Applications
6th Edition
ISBN:9781119256830
Author:Amos Gilat
Publisher:Amos Gilat
Chapter1: Starting With Matlab
Section: Chapter Questions
Problem 1P

Related questions

Question
Scores on the Wechsler Adult intelligence Scale (a standard ID test) for certain age group are
A. What percent of IQ scores are less than 122?
B. What is the probability that a randomly selected adult in this age group has an IQ score higher than 147? Is this a significant/unusual event? Explain.
C. What percent of adults in this age group have IQs between 85 and 100? Is this significant/unusual event? Explain.
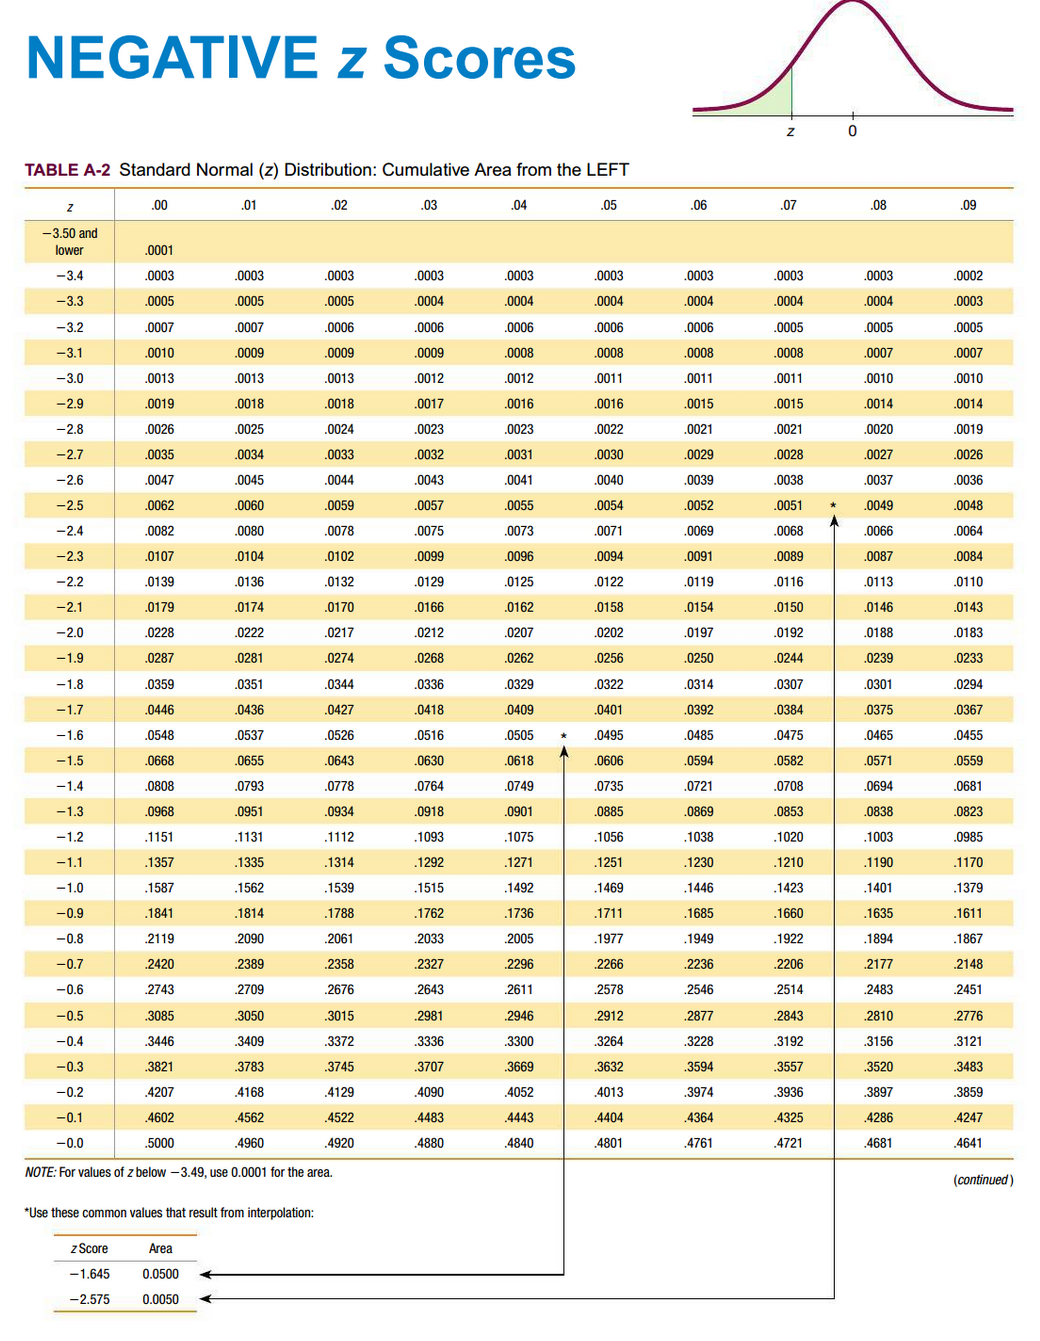
Transcribed Image Text:NEGATIVE z Scores
TABLE A-2 Standard Normal (z) Distribution: Cumulative Area from the LEFT
.00
.01
.02
.03
.04
.05
.06
.07
.08
.09
-3.50 and
lower
.0001
-3.4
.0003
.0003
.0003
.0003
.0003
.0003
.0003
.0003
.0003
.0002
-3.3
.0005
.0005
.0005
.0004
.0004
.0004
.0004
.0004
.0004
.0003
-3.2
.0007
.0007
.0006
.0006
.0006
.0006
.0006
.0005
.0005
.0005
-3.1
.0010
.0009
.0009
0009
.0008
.0008
.0008
.0008
.0007
.0007
-3.0
.0013
.0013
.0013
.0012
.0012
.0011
.0011
.0011
.0010
.0010
-2.9
.0019
.0018
.0018
.0017
.0016
.0016
.0015
.0015
.0014
.0014
-2.8
.0026
.0025
.0024
.0023
.0023
.0022
.0021
.0021
.0020
.0019
-2.7
.0035
.0034
.0033
.0032
.0031
.0030
.0029
.0028
.0027
.0026
-2.6
.0047
.0045
.0044
.0043
.0041
.0040
.0039
.0038
.0037
.0036
-2.5
.0062
.0060
.0059
.0057
0055
.0054
.0052
.0051
.0049
.0048
-2.4
.0082
.0080
.0078
.0075
.0073
.0071
.0069
.0068
.0066
.0064
-2.3
.0107
.0104
.0102
,0099
.0096
.0094
.0091
.0089
.0087
.0084
-2.2
.0139
.0136
0132
.0129
0125
.0122
.0119
.0116
.0113
.0110
-2.1
.0179
.0174
.0170
.0166
.0162
.0158
.0154
.0150
.0146
.0143
-2.0
.0228
.0222
.0217
.0212
.0207
.0202
.0197
.0192
.0188
.0183
-1.9
.0287
.0281
.0274
.0268
.0262
.0256
.0250
.0244
.0239
.0233
-1.8
.0359
.0351
.0344
.0336
.0329
.0322
.0314
.0307
.0301
.0294
-1.7
.0446
.0436
.0427
.0418
.0409
.0401
.0392
.0384
.0375
.0367
-1.6
.0548
.0537
.0526
.0516
.0505
.0495
.0485
.0475
.0465
.0455
-1.5
.0668
.0655
.0643
.0630
.0618
.0606
.0594
.0582
.0571
.0559
-1.4
.0808
.0793
.0778
.0764
.0749
.0735
.0721
.0708
.0694
.0681
-1.3
.0968
.0951
.0934
.0918
.0901
.0885
.0869
.0853
.0838
.0823
-1.2
.1151
.1131
.1112
.1093
.1075
.1056
.1038
.1020
.1003
.0985
-1.1
.1357
.1335
.1314
.1292
.1271
.1251
.1230
.1210
.1190
.1170
-1.0
.1587
.1562
.1539
.1515
.1492
.1469
1446
.1423
.1401
.1379
-0.9
1841
.1814
.1788
.1762
.1736
.1711
.1685
.1660
.1635
1611
-0.8
.2119
.2090
.2061
.2033
.2005
.1977
.1949
.1922
.1894
.1867
-0.7
.2420
.2389
.2358
.2327
.2296
.2266
.2236
.2206
.2177
.2148
-0.6
.2743
2709
.2676
.2643
.2611
2578
.2546
.2514
.2483
.2451
-0.5
.3085
.3050
.3015
.2981
2946
2912
.2877
.2843
.2810
.2776
-0.4
3446
.3409
.3372
.3336
.3300
3264
3228
3192
.3156
3121
-0.3
.3821
3783
.3745
.3707
.3669
.3632
.3594
.3557
3520
3483
-0.2
.4207
.4168
.4129
4090
.4052
.4013
.3974
.3936
.3897
.3859
-0.1
.4602
.4562
.4522
.4483
.4443
4404
.4364
.4325
.4286
.4247
-0.0
.5000
.4960
.4920
.4880
4840
4801
4761
.4721
4681
4641
NOTE: For values of z below –3.49, use 0.0001 for the area.
(continued)
*Use these common values that result from interpolation:
z Score
Area
-1.645
0.0500
-2.575
0.0050
N
Expert Solution
This question has been solved!
Explore an expertly crafted, step-by-step solution for a thorough understanding of key concepts.

This is a popular solution!

Trending now
This is a popular solution!

Step by step
Solved in 3 steps

Knowledge Booster


Learn more about
Need a deep-dive on the concept behind this application? Look no further. Learn more about this topic, statistics and related others by exploring similar questions and additional content below.Recommended textbooks for you
MATLAB: An Introduction with Applications
Statistics
ISBN:
9781119256830
Author:
Amos Gilat
Publisher:
John Wiley & Sons Inc

Probability and Statistics for Engineering and th…
Statistics
ISBN:
9781305251809
Author:
Jay L. Devore
Publisher:
Cengage Learning

Statistics for The Behavioral Sciences (MindTap C…
Statistics
ISBN:
9781305504912
Author:
Frederick J Gravetter, Larry B. Wallnau
Publisher:
Cengage Learning
MATLAB: An Introduction with Applications
Statistics
ISBN:
9781119256830
Author:
Amos Gilat
Publisher:
John Wiley & Sons Inc
Probability and Statistics for Engineering and th…
Statistics
ISBN:
9781305251809
Author:
Jay L. Devore
Publisher:
Cengage Learning
Statistics for The Behavioral Sciences (MindTap C…
Statistics
ISBN:
9781305504912
Author:
Frederick J Gravetter, Larry B. Wallnau
Publisher:
Cengage Learning

Elementary Statistics: Picturing the World (7th E…
Statistics
ISBN:
9780134683416
Author:
Ron Larson, Betsy Farber
Publisher:
PEARSON

The Basic Practice of Statistics
Statistics
ISBN:
9781319042578
Author:
David S. Moore, William I. Notz, Michael A. Fligner
Publisher:
W. H. Freeman

Introduction to the Practice of Statistics
Statistics
ISBN:
9781319013387
Author:
David S. Moore, George P. McCabe, Bruce A. Craig
Publisher:
W. H. Freeman