Let us consider the exponential distribution with density function f(y|0) = 0e-y and an i.i.d. sample Y; ~Exponential (0) for i = 1,..., n. a) Show that a gamma prior distribution is conjugate for 0.
Let us consider the exponential distribution with density function f(y|0) = 0e-y and an i.i.d. sample Y; ~Exponential (0) for i = 1,..., n. a) Show that a gamma prior distribution is conjugate for 0.

MATLAB: An Introduction with Applications
6th Edition
ISBN:9781119256830
Author:Amos Gilat
Publisher:Amos Gilat
Chapter1: Starting With Matlab
Section: Chapter Questions
Problem 1P

Related questions
Question
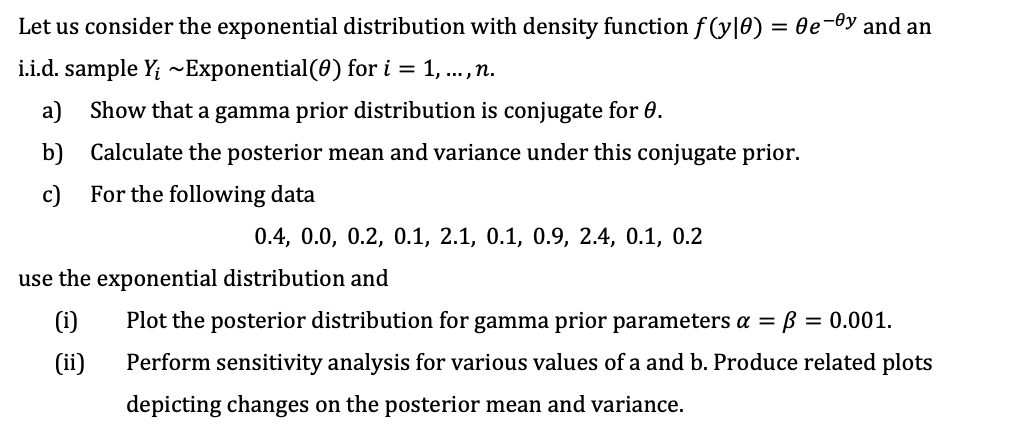
Transcribed Image Text:Let us consider the exponential distribution with density function f(y|0) = 0e-y and an
i.i.d. sample Y; ~Exponential (0) for i = 1, ..., n.
a) Show that a gamma prior distribution is conjugate for 0.
b) Calculate the posterior mean and variance under this conjugate prior.
c) For the following data
0.4, 0.0, 0.2, 0.1, 2.1, 0.1, 0.9, 2.4, 0.1, 0.2
use the exponential distribution and
(i)
(ii)
Plot the posterior distribution for gamma prior parameters a = B = 0.001.
Perform sensitivity analysis for various values of a and b. Produce related plots
depicting changes on the posterior mean and variance.
Expert Solution
This question has been solved!
Explore an expertly crafted, step-by-step solution for a thorough understanding of key concepts.

Step by step
Solved in 3 steps

Follow-up Questions
Read through expert solutions to related follow-up questions below.
Follow-up Question
Question C

Transcribed Image Text:Let us consider the exponential distribution with density function ƒ(y|0) = 0e¯ºy and an
i.i.d. sample Y₁ ~Exponential (0) for i = 1, ..., n.
a) Show that a gamma prior distribution is conjugate for 0.
b)
Calculate the posterior mean and variance under this conjugate prior.
c) For the following data
0.4, 0.0, 0.2, 0.1, 2.1, 0.1, 0.9, 2.4, 0.1, 0.2
use the exponential distribution and
(i)
(ii)
Plot the posterior distribution for gamma prior parameters a = В
Perform sensitivity analysis for various values of a and b. Produce related plots
depicting changes on the posterior mean and variance.
= 0.001.
Solution
Follow-up Question
question b and c

Transcribed Image Text:Let us consider the exponential distribution with density function f(y|0) = 0e-y and an
i.i.d. sample Y; ~Exponential (0) for i = 1, ..., n.
a) Show that a gamma prior distribution is conjugate for 0.
b) Calculate the posterior mean and variance under this conjugate prior.
c) For the following data
0.4, 0.0, 0.2, 0.1, 2.1, 0.1, 0.9, 2.4, 0.1, 0.2
use the exponential distribution and
(i)
(ii)
Plot the posterior distribution for gamma prior parameters a = B = 0.001.
Perform sensitivity analysis for various values of a and b. Produce related plots
depicting changes on the posterior mean and variance.
Solution
Recommended textbooks for you
MATLAB: An Introduction with Applications
Statistics
ISBN:
9781119256830
Author:
Amos Gilat
Publisher:
John Wiley & Sons Inc

Probability and Statistics for Engineering and th…
Statistics
ISBN:
9781305251809
Author:
Jay L. Devore
Publisher:
Cengage Learning

Statistics for The Behavioral Sciences (MindTap C…
Statistics
ISBN:
9781305504912
Author:
Frederick J Gravetter, Larry B. Wallnau
Publisher:
Cengage Learning
MATLAB: An Introduction with Applications
Statistics
ISBN:
9781119256830
Author:
Amos Gilat
Publisher:
John Wiley & Sons Inc
Probability and Statistics for Engineering and th…
Statistics
ISBN:
9781305251809
Author:
Jay L. Devore
Publisher:
Cengage Learning
Statistics for The Behavioral Sciences (MindTap C…
Statistics
ISBN:
9781305504912
Author:
Frederick J Gravetter, Larry B. Wallnau
Publisher:
Cengage Learning

Elementary Statistics: Picturing the World (7th E…
Statistics
ISBN:
9780134683416
Author:
Ron Larson, Betsy Farber
Publisher:
PEARSON

The Basic Practice of Statistics
Statistics
ISBN:
9781319042578
Author:
David S. Moore, William I. Notz, Michael A. Fligner
Publisher:
W. H. Freeman

Introduction to the Practice of Statistics
Statistics
ISBN:
9781319013387
Author:
David S. Moore, George P. McCabe, Bruce A. Craig
Publisher:
W. H. Freeman