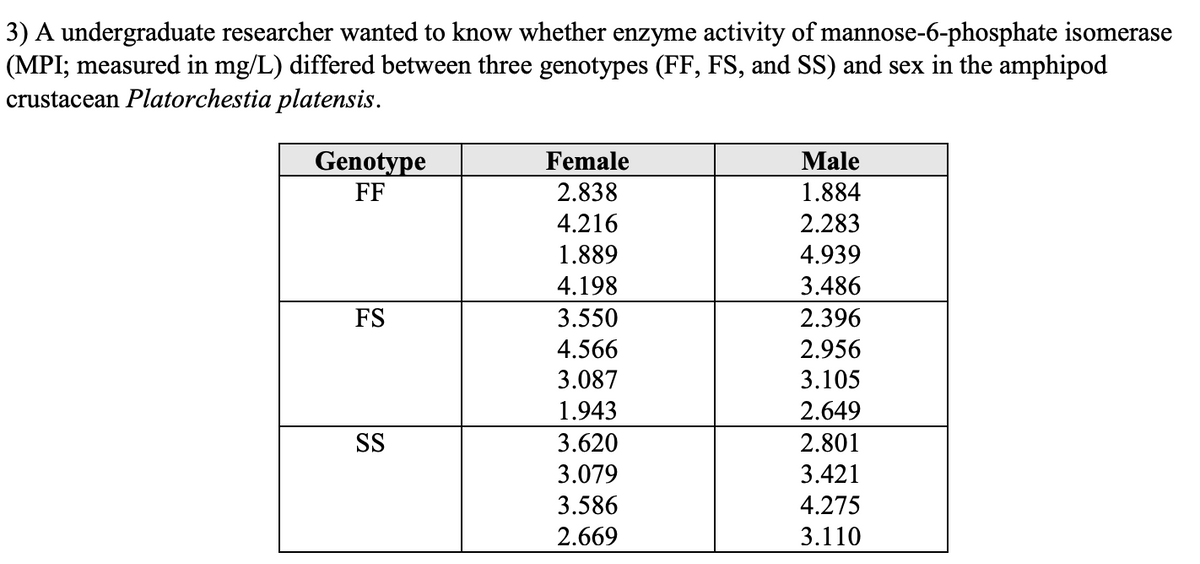
What type of test would best fit this problem?


Q: What is the third quartile
A: We are asked to find the third quartile
Q: Which of these two research objectives may be addressed using Chi-Square test of independence?
A: Chi square test of independence is used to determine whether two variables are dependent or not.
Q: The purpose of dividing the data into training and validation sets is to ensure that the results are…
A: solution
Q: How do you think you would know how far from normal your data can be for a robust test to still…
A: The objective of factual testing is to find the worth of a boundary where the likelihood of that…
Q: Can you give an example of how the importance of the goodness of fit test to the chi-square test?
A: Step 1: The goodness of fit test to the chi-square test is a statistical hypothesis, which helps to…
Q: If Quartile 3 = 35 and Quartile 1 = 25 in this case what will be the value of Quartile 2?
A:
Q: What would be the consequence of a Type II error in this setting?
A: The type II error is defined as the accepting the null hypothesis when actually the alternative…
Q: A simple main effect test is appropriate for analyzing which significant result?
A: Simple Effects : is appropriate for analyzing a significant interaction, follow-up tests are…
Q: There are 3 kinds of estimation approaches
A: There are more than 3 kinds of estimation approaches like as Maximum likelihood Method , Method of…
Q: If the standardized mortality ratio from a textile worker industry were 4.0 or 400% and the…
A:
Q: Which method describes an experiment?
A: HERE scenarios are given for check whether additive improve milage of car
Q: A researcher is evaluating the effectiveness of meditation for reducing stress by measuring stress…
A: Solution The researcher wants to test the effectiveness of meditation for reducing stress by…
Q: If you are making 4 comparisons between means, then based on the Bonferroni correction, you should…
A: Introduction: While performing an analysis, a researcher may often need to make multiple comparisons…
Q: What type of test would be ap are different from the average
A: From given data we have : sample size = 25 standard deviation = 5
Q: Explain the assumptions for testing the difference between two means?
A: Suppose nx random observations, X1, X2, …, Xm are taken from the first population and ny random…
Q: For a two-factor ANOVA, what characteristics will yield a larger F-ratio?
A: We have to describe the characteristics of larger F ratio for two factor ANOVA.
Q: Suppose we want to use systolic blood pressure to predict diastolic blood pressure. The explanatory…
A: Solution
Q: How do I solve for the mean, quartile 1 and 3?
A: To calculate the mean, median, mode, quartile 1 and quartile 2 of the given data, we should first…
Q: A low power of the test is not caused by...
A: Power of test: This will require some general knowledge of the magnitude of the difference that…
Q: To adjust our estimate of variability we subtract 1 from the sample size because we expect samples…
A: Introduction: Suppose a population consists of N units. Then, the formula for the population…
Q: When we estimate to the population from sample data (as we do with inferential statistics), why are…
A:
Q: To examine bivariate data graphically, the best choice is two side by side histograms? Define this…
A: Introduction: A histogram is a graphical display mainly used to plot a univariate continuous…
Q: When we use a least-squares line to predict y values for x values beyond the range of x values…
A: Since we were using the data to predict y beyond the range of x values , we had be extrapolating the…
Q: What is triangulations and why is it so important in qualitative research?
A: Triangulation facilitates validation of data through cross verification from more than two sources.…
Q: how do i find quartile 1 in a set of data?
A: First quartile: The first quartile is the middle-most observation or median of the lower half of the…
Q: whats an experimental hypothesis?
A: Hypotheses is the plural form for hypothesis. Hypothesis is a statement about the population…
Q: What aspect does the repeated measure test decrease when compared to an independent to test?
A: Given: The repeated measure that results in decreasing the measure test based on comparing with an…
Q: Is this a valid experimental design?
A: Here student want to check fertilizer affect the plant growth
Q: How might measurement and design errors affect respondent errors?
A: Design errors can lead to non response errors as the respondent is not sure how to answer a question…
Q: What are the response variables and explanatory variables for observing vehicles to see what the…
A: In theory of statistics, response variable is a the dependent variable, where the variation of the…
Q: here are several advantages of using a paired t-test. Since the same subjects are being tested in…
A: Paired sample t-test is useful to compare the effect of a treatment before and after the scenario.…
Q: I cannot find the test statistic for the image of the problem
A: For sample 1 (With almonds): xi xi-x (xi-x)2 3 1.142857 1.306122122 1 -0.85714 0.734694122…
Q: The primary difference between an experimental and observational study is:
A: In observational study, the data is collected based on observing the data of interest. In…
Q: What is Alpha?
A:
Q: What is the main limitation of this study? In 2009, investigators were interested in evaluating the…
A: Given information: The investigator wants to evaluate the relationship between physical activity and…
Q: What is the empirical rule?
A: The word 'empirical' stands for 'based on observations. The 68–95–99.7 rule, also known as the…
Q: How to create a good research hypothesis?
A: *Answer : There are several criteria that make a research hypothesis a good one, and following…
Q: holders were more likely to have jobs), why would the chi-square test be inappropriate for this…
A: Provided information is, students are measured on whether they had an internship during their time…
Q: What are the Four Steps to use when working with the t-test ?
A: The Four Steps to use when working with the t-test with p-value approach is given below: Step 1:…
Q: State the empirical rule as specialized to variables.
A: Empirical rule- It is also called as 3-sigma rule, because in this all the data falls under 3…
Q: For what types of data do we use chi-square tests?
A: Given : Chi-square tests
Q: When trying to determine how many samples are needed to perform an experiment, the desired accuracy…
A: It is given that margin of error (E) is 0.05 and the confidence level is 0.95.
Q: What distinguishes interpolation from other form of approximation?
A: Interpolation is the process of estimating the value of function for any intermediate value on an…
Q: The effectiveness of surgery for weight loss reported here found that "The surgery was associated…
A: The difference between initial weight and the final weight is determined for each subjects.
Q: Why is the Chi- square test applicable to the given scenario?
A: For the given sample data, we will conduct a chi-square test for independence.
Q: Why are post hoc tests performed?
A: Analysis of variance test is used to analyse the significant difference among the group means in the…
Q: What is the primary weakness of sensitivityanalysis? What is its primary usefulness?
A: Weaknesses of sensitivity analysis It assumes that changes to variables can be made independently,…
What type of test would best fit this problem?

Step by step
Solved in 3 steps with 1 images


- 1. Suppose that, in Example 2.27, 400 units of food A, 600 units of B, and 600 units of C are placed in the test tube each day and the data on daily food consumption by the bacteria (in units per day) are as shown in Table 2.6. How many bacteria of each strain can coexist in the test tube and consume all of the food? Table 2.6 Bacteria Strain I Bacteria Strain II Bacteria Strain III Food A 1 2 0 Food B 2 1 1 Food C 1 1 2The article “Effects of Diets with Whole Plant-Origin Proteins Added with Different Ratiosof Taurine:Methionine on the Growth, Macrophage Activity and Antioxidant Capacity ofRainbow Trout (Oncorhynchus mykiss) Fingerlings” (O. Hernandez, L. Hernandez, et al.,Veterinary and Animal Science, 2017:4-9) reports that a sample of 210 juvenile rainbowtrout fed a diet fortified with equal amounts of the amino acids taurine and methionine for aperiod of 70 days had a mean weight gain of 313 percent with a standard deviation of 25, while 210 fish fed with a control diet had a mean weight gain of 233 percent with a standard deviation of 19. Units are percent. Find a 99% confidence interval for the difference in weight gain on the two diets.In an experiment to determine the effect of ambient temperature on the emissons of oxides of nitrogen ( NOx ) of diesel trucks, 10 trucks were run at temperatures of 40°F and 80°F . The emissions, in parts per billion, are presented in the following table. Truck 40°F 80°F 1 926.5 896.7 2 851.1 857.0 3 975.5 952.1 4 1009.3 884.8 5 871.8 840.7 6 949.2 885.1 7 1006.3 885.5 8 836.5 777.8 9 837.8 850.2 10 958.9 882.1 Send data to Excel Let μ1 represent the mean emission at 40°F and =μd−μ1μ2 .Can you conclude that the mean emission differs between the two temperatures? Use the =α0.05 level of significance and the TI-84 Plus calculator to answer the following. p value ? do we reject? is there enough evidence :?
- 5.39 ● The following data on degree of exposure to 242Cmalpha particles (x) and the percentage of exposed cellswithout aberrations (y) appeared in the paper “Chromosome Aberrations Induced in Human Lymphocytes by D-TNeutrons” (Radiation Research [1984]: 561–573):An article reported data from a study in which both a baseline gasoline mixture and a reformulated gasoline were used. Consider the following observations on age (yr) and NOx emissions (g/kWh): Engine 1 2 3 4 5 6 7 8 9 10 Age 0 0 2 11 7 16 9 0 12 4 Baseline 1.74 4.38 4.04 1.23 5.30 0.58 3.35 3.44 0.73 1.23 Reformulated 1.85 5.93 5.52 2.67 6.54 0.76 4.94 4.87 0.69 1.39 Construct scatter plots of the baseline NOx emissions versus age. Construct scatter plots of the reformulated NOx emissions versus age. What appears to be the nature of the relationship between these two variables? As age increases, emissions also increase.As age increases, emissions decrease. There is no compelling relationship between the data.An article reported data from a study in which both a baseline gasoline mixture and a reformulated gasoline were used. Consider the following observations on age (yr) and NOx emissions (g/kWh): Engine 1 2 3 4 5 6 7 8 9 10 Age 0 0 2 11 7 16 9 0 12 4 Baseline 1.70 4.38 4.06 1.24 5.29 0.59 3.35 3.45 0.73 1.22 Reformulated 1.86 5.91 5.51 2.70 6.50 0.71 4.95 4.86 0.72 1.41 Construct scatter plots of the baseline NOx emissions versus age. What appears to be the nature of the relationship between these two variables? There is no compelling relationship between the data. As age increases, emissions also increase. As age increases, emissions decrease.
- A researcher is interested in testing the relationship between smoking and BMI (kg/m2) in adults aged 30-45. In order to test this association, the researcher divides smoking into currently more than a pack a day, currently less than a pack a day, and never smokers. The following table represents the BMIs for each participant enrolled by their respective smoking category. Current Smoker (≥1pack/day) Current Smoker (<1 pack/day Never Smoked 26.7 29.4 22.1 29.4 28.6 30.4 24.3 27.4 21.3 28.4 23.2 26.4 21.6 20.1 19.7 27.4 20.6 19.8 26.8 19.7 21.6 36.4 19.6 22.3 31.5 21.6 24.3 27.4 21.5 *Continue as though all assumptions for ANOVA are met. A) Calculate the MSW and MSB for the data represented above. B) Carry out a formal test for a one-way analysis of variance among the groups and interpret your results.The following table was presented in a article summarizing a study to compare a new drug to a standard drug and to a placebo. characteristic new drug stand. drug placebo p age,yrs 45.2(4.8) 44.9(5.1) 42.8(4.3) 0.5746 % female 50% 55% 57% 0.1635 annual income,$000s 59.5%(14.3) 63.8(16.9) 58.2%(13.1) 0.4635 % w/ins 87% 65% 82% 0.0352 disease stage 0.0261 stage 1 35% 18% 33% stage 2 42% 37% 47% stage 3 23% 51% 20% Are there any statistiscally significant differences…PCBs and Pelicans. Polychlorinated biphenyls (PCBs), industrial pollutants, are known to be carcinogens and a great danger to natural ecosystems. As a result of several studies, PCB production was banned in the United States in 1979 and by the Stockholm Convention on Persistent Organic Pollutants in 2001. One study, published in 1972 by R. Risebrough, is titled “Effects of Environmental Pollutants Upon Animals Other Than Man” (Proceedings of the 6th Berkeley Symposium on Mathematics and Statistics, VI, University of California Press, pp. 443–463). In that study, 60 Anacapa pelican eggs were collected and measured for their shell thickness, in millimeters (mm), and concentration of PCBs, in parts per million (ppm). The data are on the WeissStats site. a. obtain and interpret the standard error of the estimate. b. obtain a residual plot and a normal probability plot of the residuals. c. decide whether you can reasonably consider Assumptions 1–3 for regression inferences met by the two…
- An automotive engineer is investigating two different types of metering devices for an electronic fuel injection system to determine whether they differ in their fuel mileage performance. The system is installed on 10 different cars, and a test is run with each metering device on each car. The data is provided below: Metering Device Car 1 2 1 17.6 16.8 2 19.4 20.0 3 18.2 17.6 4 17.1 16.4 5 15.3 16.0 6 15.9 15.9 7 16.3 16.5 8 18.0 18.4 9 17.3 16.4 10 19.1 20.1 Is there a significant difference between the means of the two metering devices? Use . Interpret the result in the context of the problem. An article in the journal Hazardous Waste and Hazardous Materials (Vol. 6, 1989) reported the results of an analysis of the weight of calcium in standard cement and cement doped with lead. Reduced levels of calcium would indicate that the hydration mechanism in the cement is blocked…The article “Effect of Varying Solids Concentration and Organic Loading on the Performance of Temperature Phased Anaerobic Digestion Process” (S. Vandenburgh and T. Ellis, Water Environment Research, 2002:142–148) discusses experiments to determine the effect of the solids concentration on the performance of treatment methods for wastewater sludge. In the first experiment, the concentration of solids (in g/L) was 43.94 ± 1.18. In the second experiment, which was independent of the first, the concentration was 48.66 ± 1.76. Estimate the difference in the concentration between the two experiments, and find the uncertainty in the estimate.The number of contaminating particles on a silicon waferprior to a certain rinsing process was determined for eachwafer in a sample of size 100, resulting in the followingfrequencies:Number of particles 0 1 2 3 4 5 6 7Frequency 1 2 3 12 11 15 18 10Number of particles 8 9 10 11 12 13 14Frequency 12 4 5 3 1 2 1a. What proportion of the sampled wafers had at leastone particle? At least five particles?b. What proportion of the sampled wafers had betweenfive and ten particles, inclusive? Strictly between fiveand ten particles?c. Draw a histogram using relative frequency on thevertical axis. How would you describe the shape of thehistogram?