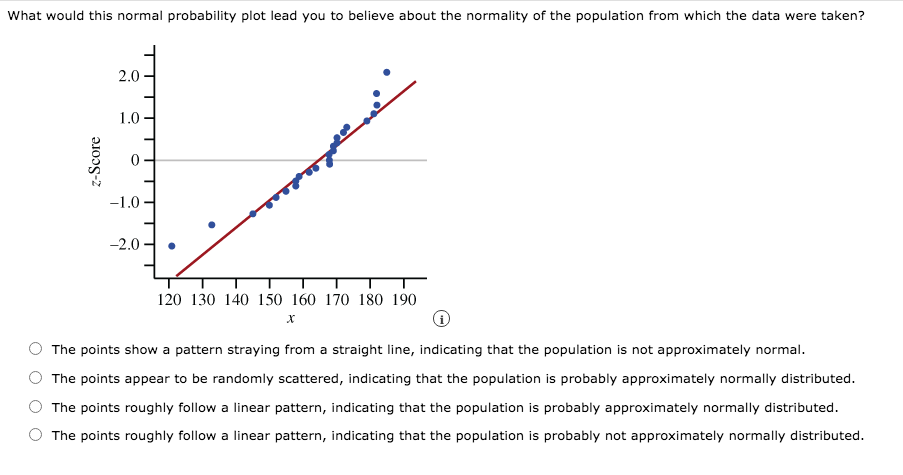
What would this normal probability plot lead you to believe about the normality of the population from which the data were taken? 2.0 1.0 -1.0 - -2.0 120 130 140 150 160 170 180 190 The points show a pattern straying from a straight line, indicating that the population is not approximately normal. The points appear to be randomly scattered, indicating that the population is probably approximately normally distributed. The points roughly follow a linear pattern, indicating that the population is probably approximately normally distributed. The points roughly follow a linear pattern, indicating that the population is probably not approximately normally distributed. z-Score
What would this normal probability plot lead you to believe about the normality of the population from which the data were taken? 2.0 1.0 -1.0 - -2.0 120 130 140 150 160 170 180 190 The points show a pattern straying from a straight line, indicating that the population is not approximately normal. The points appear to be randomly scattered, indicating that the population is probably approximately normally distributed. The points roughly follow a linear pattern, indicating that the population is probably approximately normally distributed. The points roughly follow a linear pattern, indicating that the population is probably not approximately normally distributed. z-Score
Glencoe Algebra 1, Student Edition, 9780079039897, 0079039898, 2018
18th Edition
ISBN:9780079039897
Author:Carter
Publisher:Carter
Chapter10: Statistics
Section10.3: Measures Of Spread
Problem 23PFA
Related questions
Question

Transcribed Image Text:What would this normal probability plot lead you to believe about the normality of the population from which the data were taken?
2.0
1.0
-1.0
-2.0
120 130 140 150 160 170 180 190
The points show a pattern straying from a straight line, indicating that the population is not approximately normal.
The points appear to be randomly scattered, indicating that the population is probably approximately normally distributed.
The points roughly follow a linear pattern, indicating that the population is probably approximately normally distributed.
The points roughly follow a linear pattern, indicating that the population is probably not approximately normally distributed.
z-Score
Expert Solution
This question has been solved!
Explore an expertly crafted, step-by-step solution for a thorough understanding of key concepts.
This is a popular solution!
Trending now
This is a popular solution!
Step by step
Solved in 2 steps

Knowledge Booster
Learn more about
Need a deep-dive on the concept behind this application? Look no further. Learn more about this topic, statistics and related others by exploring similar questions and additional content below.Recommended textbooks for you

Glencoe Algebra 1, Student Edition, 9780079039897…
Algebra
ISBN:
9780079039897
Author:
Carter
Publisher:
McGraw Hill

Glencoe Algebra 1, Student Edition, 9780079039897…
Algebra
ISBN:
9780079039897
Author:
Carter
Publisher:
McGraw Hill