When computing the regression analysis in excel, which columns would be my independant, x variables? pics.
When computing the regression analysis in excel, which columns would be my independant, x variables? pics.

Algebra & Trigonometry with Analytic Geometry
13th Edition
ISBN:9781133382119
Author:Swokowski
Publisher:Swokowski
Chapter10: Sequences, Series, And Probability
Section10.3: Geometric Sequences
Problem 82E

Related questions
Question
100%
When computing the
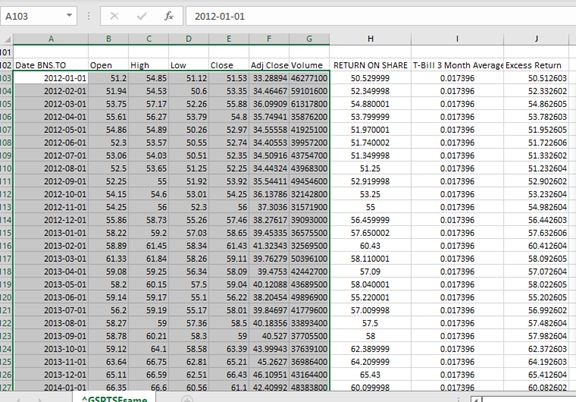
Transcribed Image Text:A103
2012-01-01
A
B
CD
E
F
101
102 Date BNS.TO
Adj Close Volume
51.53 33.28894 46277100
53.35 34.46467 59101600
Open
High
Low
Close
RETURN ON SHARE T-Bill 3 Month Average Excess Return
103
104
105
106
107
108
109
110
2012-01-01
51.2
54.85
51.12
50.529999
0.017396
50.512603
2012-02-01
51.94
54.53
50.6
52.349998
0.017396
52.332602
2012-03-01
53.75
57.17
52.26
55.88 36.09909 61317800
54.880001
0.017396
54.862605
2012-04-01
55.61
56.27
53.79
54.8 35.74941 35876200
53.799999
0.017396
53.782603
2012-05-01
54.86
54.89
50.26
52.97 34.55558 41925100
51.970001
0.017396
51.952605
2012-06-01
52.3
53.57
50.55
52.74 34.40553 39957200
51.740002
0.017396
51.722606
2012-07-01
53.06
54.03
50.51
52.35 34.50916 43754700
51.349998
0.017396
51.332602
2012-08-01
52.5
53.65
51.25
52.25 34,44324 43968300
51.25
0.017396
51.232604
111
112
2012-09-01
52.25
55
51.92
53.92 35.54411 49454600
52.919998
0.017396
52.902602
2012-10-01
54.15
54.6
53.01
54.25 36.13786 32142800
53.25
0.017396
53.232604
113
2012-11-01
54.25
56
52.3
56 37.3036 31571900
55
0.017396
54.982604
14
2012-12-01
55.86
58.73
55.26
57.46 38.27617 39093000
56.459999
0.017396
56.442603
15
2013-01-01
58.22
59.2
57.03
58.65 39.45335 36575500
57.650002
0.017396
57.632606
16
17
118
119
120
121
122
123
124
125
126
127
2013-02-01
58.89
61.45
58.34
61.43 41.32343 32569500
60.43
0.017396
60.412604
2013-03-01
61.33
61.84
58.26
59.11 39.76279 50396100
58.110001
0.017396
58.092605
2013-04-01
59.08
59.25
56.34
58.09 39.4753 42442700
57.09
0.017396
57.072604
2013-05-01
58.2
60.15
57.5
59.04 40.12088 43689500
58.040001
0.017396
58.022605
2013-06-01
59.14
59.17
55.1
56.22 38.20454 49896900
55.220001
0.017396
55.202605
2013-07-01
56.2
59.19
55.17
58.01 39.84697 41779600
57.009998
0.017396
56.992602
2013-08-01
58.27
59
57.36
58.5 40.18356 33893400
57.5
0.017396
57.482604
2013-09-01
58.78
60.21
58.3
59
40.527 37705500
58
0.017396
57.982604
2013-10-01
59.12
64.1
58.58
63.39 43.99943 37639100
62.389999
0.017396
62.372603
2013-11-01
45.2627 36986400
66.43 46.10951 43164400
61.1 42.40992 48383800
63.64
66.75
62.81
65.21
64.209999
0.017396
64.192603
2013-12-01
65.11
66.59
62.51
65.43
0.017396
65.412604
2014-01-01
66.35
66.6
60.56
60.099998
0.017396
60.082602
AGSRTSEsame
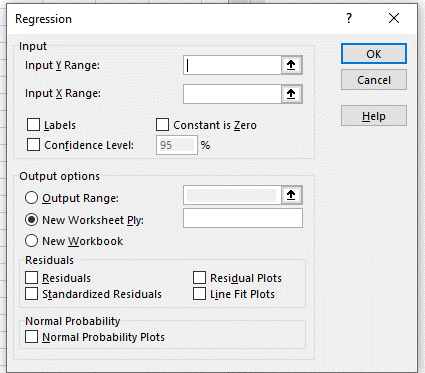
Transcribed Image Text:Regression
? X
Input
OK
Input Y Range:
Cancel
Input X Range:
Help
Labels
Constant is Zero
O Confidence Level:
95
%
Output options
Output Range:
New Worksheet Ply:
O New Workbook
Residuals
Residual Plots
Line Fit Plots
Residuals
Standardized Residuals
Normal Probability
O Normal Probability Plots
Expert Solution
This question has been solved!
Explore an expertly crafted, step-by-step solution for a thorough understanding of key concepts.

Step by step
Solved in 2 steps

Recommended textbooks for you
Algebra & Trigonometry with Analytic Geometry
Algebra
ISBN:
9781133382119
Author:
Swokowski
Publisher:
Cengage
Algebra & Trigonometry with Analytic Geometry
Algebra
ISBN:
9781133382119
Author:
Swokowski
Publisher:
Cengage