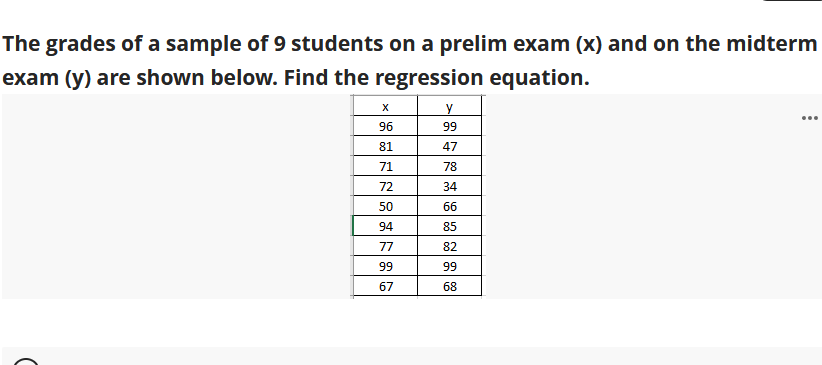
The grades of a sample of 9 students on a prelim exam (x) and on the midterm exam (y) are shown below. Find the regression equation. 96 99 81 47 71 78 72 34 50 66 94 85 77 82 99 99 67 68


Q: The grades of a class of 9 students on a midterm report (r) and on the final examination (v) are 55…
A: Given Information: Below are the grades of class 9 students on a midterm report and on the final…
Q: Find the regression equation, letting the first variable be the predictor (x) variable. Using the…
A: In simple linear regression, there is only one independent variable and one dependent variable. The…
Q: Find the regression equation, letting the first variable be the predictor (x) variable. Using the…
A: Given: Best Actress (X): 27,32,30,59,34,33,46,30,60,21,44,51Best Actor (Y):…
Q: Find the value of s in a simple linear regression model if SSE = 175 and n = 27. O 7 24 148 6.4
A: The variance is calculated ass2=SSEn-1
Q: Based on the data shown below, calculate the regression line (each value to two decimal places)…
A: Introduction: Consider that x is the independent variable and y is the dependent variable. The size…
Q: The amounts (x) of 6 restaurant bills and the corresponding amounts (y) of the tips are given in the…
A:
Q: y 96 99 81 47 71 78 72 34 50 66 94 85 77 82 99 99 67 68 The grades of a sample of 9 students on a…
A: Find Regression line equations from the following data, X Y 96 99 81 47 71 78 72 34 50…
Q: The data below are the final exam scores of 10 randomly selected statistics students and the number…
A:
Q: 1. The table below shows the number of people, p, and suitcases, s, on 8 airplanes 63 115 153 192…
A:
Q: The prelim grades (x) and midterm grades (y) of a sample of 10 MMW students is modeled by the…
A: Solution
Q: Based on the data shown below, calculate the regression line (show each value to two decimal places)…
A:
Q: Find the regression equation, letting the first variable be the predictor (x) variable. Using the…
A:
Q: 7. The grades of a class of 9 students on a midterm report (x) and on the final examination (y) are…
A: Regression line is given by,
Q: Find the regression equation, letting the first variable be the predictor (x) variable. Using the…
A: According to the question, the independent variable is the best actress age (x) and the dependent…
Q: Find the regression equation, letting the first variable be the predictor (x) variable. Using the…
A: Use EXCEL to determine the regression equation. EXCEL procedure: Go to EXCEL Go to Data>Data…
Q: Find the regression equation, letting the first variable be the predictor (x) variable. Using the…
A:
Q: 139 264 278 470 569 304 675 271 162 Y 94 222 241 428 500 275 394 232 | 133 а) Compute the…
A: x y u v u2 v2 uv 139 94 -361 -406 130321 164836 146566 264 222 -236 -278 55696 77284 65608 278…
Q: Find the regression equation, letting the first variable be the predictor (x) variable. Using the…
A: Equation of the regression line: The equation of the regression line is obtained below. From the…
Q: The grades of a selected 9 students of Math 122 class on a midterm report and on the final report…
A: Hi! Thank you for the question, As per the honor code, we are allowed to answer three sub-parts at a…
Q: A specialist in hospitality states that the number of Room Sold per month in a hotel (RS) can be…
A: From the Given information, Y: The number of rooms(RS) X: Online advertising amounts(QA) x y…
Q: ... 96 99 81 47 71 78 72 34 50 66 94 85 77 82 99 99 67 68 The grades of a sample of 9 students on a…
A:
Q: Find the regression equation, letting the first variable be the predictor (x) variable. Using the…
A: Calculate the following values: x y (xi - mean_x)2 (yi - mean_y)2 (xi - mean_x)*(yi - mean_y)…
Q: a) The grades of a class of 9 students on a mid term report(X) and the final examination(Y) are as…
A: (a) Let X denote the Mid term report Let Y denote the final examination Calculation: From the…
Q: H.w: COMPUTE the CORELATON and the REGRESSION EQUATION for the variable yı and xi X 3 6. 15 18 21 24…
A: X:- 0, 3, 6, 9, 12, 15, 18, 21, 24, 27, 30, 33, 36 Y:- 2, 6, 12, 18, 24, 30, 36, 40, 44, 49, 55, 61,…
Q: The grades of a class of 9 students on a midterm report (x) and on the final examination (y) are as…
A: (a). Let X denote the Mid term report Let Y denote the final examination Calculation :…
Q: students. Make a simple regression model by following the format utilized in the above examples.…
A:
Q: Find the regression equation, letting the first variable be the predictor (x) variable. Using the…
A:
Q: Based on the data shown below, calculate the regression line (each value to two decimal places) y =…
A:
Q: The grades of a selected 9 students of Math 122 class on a midterm report and on the final report…
A: Since you have posted a question with multiple sub-parts, we will solve first three sub- parts for…
Q: Find the regression equation, letting the first variable be the predictor (x) variable. Using the…
A:
Q: The grades of a sample of 9 students on a prelim exam (x) and on the midterm exam (y) are shown…
A: Calculate Fitting a straight line - Curve fitting using Least square method X Y 96 99 81 47…
Q: A specialist in hospitality states that the number of Room Sold per month in a hotel (RS) can be…
A: From the Given information, Y: The number of rooms(RS) X: Online advertising amounts(QA) x y…
Q: The grades of 7 students in the midterm and final grading period are shown in the table. Find the…
A: First we find required data from table. Then we calculate line of regression using formula.
Q: The following table shows the age (X) and blood pressure (Y) of 8 persons : X: 52 63 45 36 72 65 47…
A:
Q: In a regression analysis, if r2 = 1, then _____. a. SSR = SSE b. SSE = 1…
A: From the provided information,
Q: 1.) The table below is about the academic performance in Mathematics of 10 students. Make a simple…
A: The regression analysis is conducted here by using EXCEL. The software procedure is given below:…
Q: The amounts of 6 restaurant bills and the corresponding amounts of the tips are given in the table…
A: X = Bill Y = Tip Count X Y XY X^2 1 97.34 16 1557.44 9475.0756 2 106.27 16 1700.32 11293.3129…
Q: y 96 99 81 47 71 78 72 34 50 66 94 85 77 82 99 99 67 68
A:
Q: A specialist in hospitality states that the number of Room Sold per month in a hotel (RS) can be…
A: Let X be the online advertising amounts and Y be the number of rooms sold for12 hotels. X Y 23…
Q: Run a regression analysis on the following data set, where y is the final grade in a math class and…
A: Given data, X Y X*Y X*X 5 60 300 25 10 63 630 100 10 75 750 100 12 75.8 909.6 144 12…
Q: Based on the data shown below, calculate the regression line (show each value to two decimal places)…
A: Consider the following table-
Q: Based on the data shown below, calculate the regression line (each value to two decimal places) y =…
A: The sums are, x y x2 xy 3 16.52 9 49.56 4 16.36 16 65.44 5 20.4 25 102 6 19.74 36 118.44…
Q: The number initial public offerings of stock issued in a 10-year period and the total proceeds of…
A: How can the coefficient of determination be interpreted?
Q: 96 99 81 47 71 78 72 34 50 66 94 85 77 82 99 99 67 68 The grades of a sample of 9 students on a…
A: Calculate Fitting a straight line(Regression line) - Curve fitting using Least square method X Y…
Q: Use the given data to find the equation of the regression line. Examine the scatterplot and identify…
A:
Q: Based on the data shown below, calculate the regression line (each value to two decimal places) Find…
A:
Q: Run a regression analysis on the following data set, where y is the final grade in a math class and…
A:
Q: Find the regression equation, letting the first variable be the predictor (x) variable. Using the…
A: Given,
Q: Find the regression equation, letting the first variable be the predictor (x) variable. Using the…
A: Given Observation Best Actress(x) Best Actor(y) 27 41 29 35 30 37 60 46 31 49 31 47…
Q: Use the given data to find the equation of the regression line. x 1.2 1.4 1.6 1.7 2.1 y 54 53 54 55…
A:

Step by step
Solved in 2 steps

- The following fictitious table shows kryptonite price, in dollar per gram, t years after 2006. t= Years since 2006 0 1 2 3 4 5 6 7 8 9 10 K= Price 56 51 50 55 58 52 45 43 44 48 51 Make a quartic model of these data. Round the regression parameters to two decimal places.Olympic Pole Vault The graph in Figure 7 indicates that in recent years the winning Olympic men’s pole vault height has fallen below the value predicted by the regression line in Example 2. This might have occurred because when the pole vault was a new event there was much room for improvement in vaulters’ performances, whereas now even the best training can produce only incremental advances. Let’s see whether concentrating on more recent results gives a better predictor of future records. (a) Use the data in Table 2 (page 176) to complete the table of winning pole vault heights shown in the margin. (Note that we are using x=0 to correspond to the year 1972, where this restricted data set begins.) (b) Find the regression line for the data in part ‚(a). (c) Plot the data and the regression line on the same axes. Does the regression line seem to provide a good model for the data? (d) What does the regression line predict as the winning pole vault height for the 2012 Olympics? Compare this predicted value to the actual 2012 winning height of 5.97 m, as described on page 177. Has this new regression line provided a better prediction than the line in Example 2?The grades of a sample of 9 students on a prelim exam (x) and on the midterm exam (y) are shown below. Find the regression equation. y = 34.661 + 0.433x y = 0.777 + 12.0623x y = 12.0623 + 0.777x y = 34.661 - 0.433x
- The prelim grades (x) and midterm grades (y) of a sample of 10 MMW students is modeled by the regression line y = 12.0623 + 0.7771x. Estimate the prelim grade if the midterm grade is 83.The grades of a class of 9 students on a midterm report (x) and on the final examination (y) are as follows: Give the following: a. linear regression line and equation b. computation of the coefficient of determination ?^2 c. Computation of the coefficient of correlation ? d. Estimate the final examination grade of a student who received a grade of 85 on the midterm report.The grades of a sample of 9 students on a prelim exam (x) and on the midterm exam (y) are shown in the excel worksheet. Find the regression equation
- A random sample of twelve students were chosen, and their midterm test score (y), as- signment score (x1), and missed classes (x2) were recorded as follows: Midterm Score, y Assignment Score, x1 Classes Missed, x2 85 74 76 90 85 87 94 98 81 91 76 74 65 50 55 65 55 70 65 70 55 70 50 55 5 7 5 2 6 3 2 5 4 3 1 4 (i) What is the fitted multiple linear regression equation of the form yˆ = b0 + b1x1 + b2x2? (ii) From part (i) above, estimate the midterm test score grade for a student who has an assignment score of 60 and missed 4 classes.The following table displays the mathematics test scores for a random sample ofcollege students, along with their final SY16C grades.a. Fit the regression line y=a+bx to the data and interpret the results.b. Use the regression equation to determine the SY16C grade for a college student whoscored 60 on their achievement test. What would their SY16C gradebe? Mathematics test(x) SY16C grades(y)1 39 652 43 783 21 524 64 825 57 926 47 897 28 738 75…The grades of a class of 9 students on a midterm report (x) and on the final examination (y) are as follows: (10) (x) 70 55 72 72 81 94 96 99 67 (y) 80 67 78 34 47 85 99 99 68 a. Find the equation of the regression line. b. Estimate the final examination grade of a student who received a grade of 85 on the midterm report but was ill at the time of the final examination. c. Compute the standard error of estimate.yxS.
- The table below contains the geographic latitudes, x, and average January temperatures, y, of 20 cities. Use Excel to find the best fit linear regression equation. Round the slope and intercept to two decimal places. x y46 2332 6039 4033 5938 5740 3342 3330 6434 5641 3936 4939 5447 2026 7645 2531 6239 4243 3137 5541 31 Answer: y=___x+___The quadratic regression equation shown below is for a sample of n=22. Determine the critical value(s).The number of initial public offerings of stock issued in a 10-year period and the total proceeds of these offerings (in millions) are shown in the table. The equation of the regression line is y=47.271x+18,712.47. Issues, x Proceeds, y425 18,758468 29,602678 43,797478 31,661485 65,518396 65,33069 21,42764 11,847181 32,392157 27,561 Complete parts a and b. The number of initial public offerings of stock issued in a 10-year period and the total proceeds of these offerings (in millions) are shown in the table. The equation of the regression line is y=47.271x+18,712.47. Complete parts a and b. (a) Find the coefficient of determination and interpret the result. (Round to three decimal places as needed.) (b) Find the standard error of estimate se and interpret the result. (Round to three decimal places as needed.)

