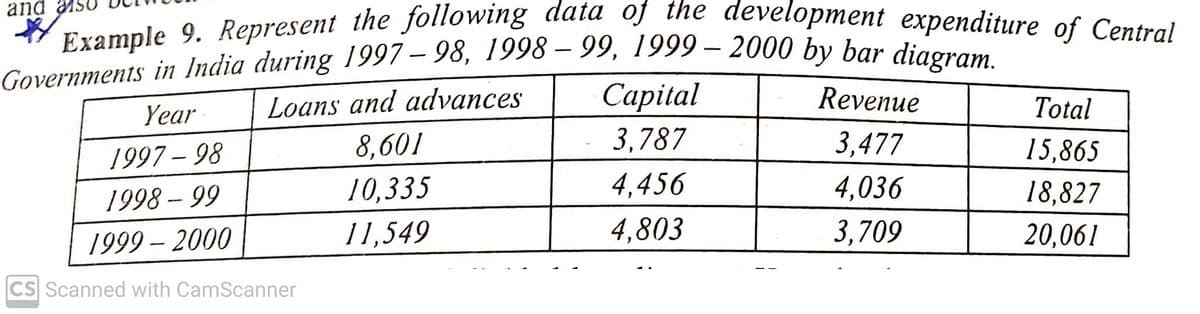
Example 9. Represent the following dald Governments in India during 1997 – 98, 1998 – 99, 1999 – 2000 by bar diandt ihe development expenditure of Central Loans and advances Capital Revenue Total Year 1997 – 98 8,601 3,787 3,477 15,865 10,335 4,456 4,036 18,827 1998 – 99 1999 – 2000 11,549 4,803 3,709 20,061 CS Scanned with CamScanner


Q: Number of pairs of observations of X and Y=8 X series Arithmetic Mean 74-5 X series Assumed Mean 69-...
A:
Q: Suppose a simple random sample of size n=50 is obtained from a population whose size is N=20,000 and...
A: Solution
Q: Simple Regression Sales Revenue Year Product Price (P) (millions of pesos) 1 1.20 0.95 1.50 0.93 2.0...
A:
Q: Four coins are tossed simultaneously. What is the probability of getting (a) 2 heads and 2 tails (b)...
A:
Q: Five pulse rates are randomly selected from a set of measurements. The five pulse rates have a mean ...
A: Given data,54,82,53,90The mean of 5 pulse rates is 67
Q: What are the null and alternative hypotheses? 0.104 versus H4: p Ho: p (Type integers or decimals. D...
A: We have given that 10.4% of workers had a travel time to work of more than 60 minutes. Here, we woul...
Q: (a) Compute the length of the middle 95% of all the crab leg lengths.
A: Here AS per policy I HAVE CALCULATED 3 SUBPARTS KINDLY REPOST FOR REMAINING PARTS Suppose we are e...
Q: Find out the arithmetic mean and standard devia- tion from following data : Variable Frequency Varia...
A:
Q: The value of Q is:
A: here use given grouped data frequency distribution of speed
Q: Identify the symbols used for each of the following: (a) sample standard deviation; (b) population s...
A: We have given that four terminology and we need to find out there symbols
Q: Problem 3: Attournamento 0) As a preliminary helper result, show by induction that for events E1, E2...
A: Given information: Consider a tournament between N teams, each team playing each of the other teams....
Q: If the sampled population has a mean of A = 04 and a population standard deviation of o = distributi...
A: We have given that, Population mean (μ) = 64, population standard deviation (σ) = 10 and sample si...
Q: The time required for an automotive center to complete an oil change service on an automobile approx...
A: We have given that. X~N( μ , ?^2 ) μ=17 , ? =2 Z-score =( x - μ )/?
Q: A company wishes to purchase one of five different printers: A, B, C, D and E. In an experiment desi...
A: Hypothesis testing : Hypothesis testing is a type of statistical inference that uses sample data to ...
Q: One of the more popular statistics reported in the media is the president's job approval rating. The...
A: State the hypotheses.
Q: The claim is that for a smartphone carrier's data speeds at airports, the mean is μ=18.00 Mbps. Th...
A: Given information Hypothesized mean µ = 18.00 Mbps Sample size (n) = 24 The value of test statistics...
Q: Twenty years ago, 52%of parents of children in high school felt it was a serious problem that high...
A:
Q: High power experimental engines are being developed by the Stevens Motor Company for use in its new ...
A: The random variable maximum horse power follows normal distribution. We have to test whether the ave...
Q: Let X1, , X, be iid with population pdf given by h ( which integrates to 1 over the real line. Here,...
A:
Q: Which of the following statements about interpreting standard deviation is true? Chebyshev's R...
A: Solution-: Which of the following statements about interpreting standard deviation is true? (1) C...
Q: he given quantities below were calculated from a sample data set. Σ 1-230 Συ- 198 Ey = 2664 Σ II 2 =...
A: Given data,
Q: The geometric mean is often used in business and economics for finding average rates of change, aver...
A: Given that We have to find a...The average growth factor b.. The single percentage growth rate ...
Q: Goofy Marketing Solutions conducted a survey among 16 randomly selected visitors to the newly opened...
A:
Q: Goofy Marketing Solutions conducted a survey among 16 randomly selected vis to the newly opened Outl...
A: Given data,n=16x=67s=7.509Find Lower limit of 95% CI?
Q: Holding everything else constant, what would happen if the sample size had been greater? The confide...
A: We have given that Sample size n =16 Sample mean = 67 Sample standard deviation =7.509
Q: n a survey of 2072 adults in a recent year, 734 made a New Year's resolution to eat healthier. C...
A: Given data,Total no adults n=2072Adults made a New Year's resolution to eat healthier is x=734
Q: Problem 2. The battery life is known to be approximately normal distributed with standard deviation ...
A:
Q: What would be the average run length for a process that is in statistical control and the stopping r...
A: Average Run Length (ARL): It is typically used to measure the performance of control charts. Run Len...
Q: Stanford-binet IQ test scores are normally distributed with a mean score of 100 and a standard devia...
A: Given that Stanford-binet IQ test scores are normally distributed with a mean score of 100 and a st...
Q: The time required for an automotive center to complete an oil change service on an automobile approx...
A:
Q: 5. You are given below the following in formation about advertisement and sales. Adv. Exp. (X) Sales...
A:
Q: 8. According to the CDC (2016), the average life expectancy of someone with diabetes is u = 72 %3D y...
A:
Q: 3. Assume that military aircraft use ejection seats designed for men weighing between 145.4 lb and 2...
A: Given that AS PER THE TERMS I ANSWERED 1ST QUESTION 3RD QUESTION ALSO. 2,4 REPOST IT AGAIN.
Q: Because the mean is very sensitive to extreme values, it is not a resistant measure of center. By de...
A:
Q: Find the P-value for a left-tailed hypothesis test with a test statistic of z=−1.55. Decide whethe...
A:
Q: The length of a movie file that is available for streaming is modeled using the normal distribution ...
A: Let X be the random variable from normal distribution with mean (μ) = 190.3 and standard deviation (...
Q: Solve for the coefficient of correlation
A:
Q: The driving time for an individual from his home to his work is uniformly distributed between 300 to...
A:
Q: The blood platelet counts of a group of women have a bell-shaped distribution with a mean of 260.1 a...
A: We know that, The Empirical rule: P( μ - σ < X < μ + σ ) = 68% P( μ - 2σ < X < μ + 2σ ) ...
Q: Assume that human body temperatures are normally distributed with a mean of 98.22°F and a standard d...
A: Average = 98.22 Standard deviation = 0.63 X = 100.6 We have to answer for mentioned questions.
Q: T18=0-98, r13=0•44, and r3=0•54 Calculate the partial correlation coefficient between first and the ...
A:
Q: For a bivariate data, the mean value of X =53-2 the mean value of Y =27-9 the regression coefficient...
A:
Q: 8 Indication: Ex 9.19 of tertbook. Let X andY be two continuous random variables with joint density ...
A: Rewrite the above equation and just compare this f(x,y)=k*e{-12(ax2-2hxy+by2)} , -∞<(x,y)<...
Q: According to the "random-walk model" for stock prices, the price movements of stocks on a given day ...
A: Solution: To test the hypothesis Ho: There is no association between the variables closing price mov...
Q: A normal population has mean u = 50 and standard deviation o = 5. What is the 80th percentile of the...
A: Let Z be the random variable from normal distribution with mean (μ) = 50 and standard deviation (σ) ...
Q: If the variance of a Bar examination is 900, how large a sample is needed to estimate the true mean ...
A: Variance=σ2=900, margin of error=moe=5, level of significance=0.01
Q: After a mayor announced his plans to cut budget costs in late 2011, the Forum Research polled 1,084 ...
A:
Q: The First National Mortgage Company has noted that 11% of its customers pay their mortgage payments ...
A: As per our guidelines we can solve first three sub part of question and rest can be reposted. Soluti...
Q: If A and B are any two events, then P(A U B) = P(A) + P(B) – P(A N B) anner
A:
Q: Check your blood pressure: In a recent study, the Centers for Disease Control and Prevention reporte...
A: Given data,Mean μ=80.3sd σ=9.7

Step by step
Solved in 2 steps with 2 images

- The following data represent the net profits made by a sample of 25 companies that operate in real-state sector. Table (1) 56 97 78 61 79 93 84 76 58 92 89 96 42 44 85 77 53 88 62 84 62 82 75 95 89 Choose the best graphical presentation and justify your Based on your answer in (1), construct the selected graphical presentation and comment on the Based on your answer in (2), do you think the sector performance is satisfactory? Justify your answer.The following data represent the net profits made by a sample of 25 companies that operate in real-state sector. 56 97 78 61 79 93 84 76 58 92 89 96 42 44 85 77 53 88 62 84 62 82 75 95 89 Choose the best graphical presentation and justify your Based on your answer in (1), construct the selected graphical presentation and comment on the Based on your answer in (2), do you think the sector performance is satisfactory? Justify your answer.Make a frequency graph with Price catergories and order size. From $0-100, $100-200, $200-300 From Small Medium Large Order Received Shipped Order Size Returned 2-Jan 3-Jan $ 296.04 No 3-Jan 13-Jan $ 51.65 No 4-Jan 18-Jan $ 156.27 Yes 10-Jan 16-Jan $ 206.32 No 11-Jan 14-Jan $ 96.47 No 13-Jan 20-Jan $ 272.55 No 13-Jan 23-Jan $ 271.16 No 14-Jan 28-Jan $ 86.52 Yes 17-Jan 17-Jan $ 58.02 Yes 17-Jan 27-Jan $ 126.95 No 17-Jan 1-Feb $ 173.59 Yes 24-Jan 29-Jan $ 192.43 No 25-Jan 4-Feb $ 280.50 Yes 26-Jan 28-Jan $ 20.35 No 30-Jan 30-Jan $ 233.56 No 3-Feb 5-Feb $ 29.88 No 6-Feb 17-Feb $ 122.94 Yes 6-Feb 14-Feb $ 280.14 No 6-Feb 8-Feb $ 41.25 No 11-Feb 28-Feb $ 204.34 Yes 11-Feb 15-Feb $ 30.34 No 12-Feb 24-Feb $ 18.85 No 12-Feb 12-Feb $ 250.66 No 14-Feb 16-Feb $ 249.50 No 15-Feb 3-Mar $ 54.22 Yes 15-Feb 24-Feb $ 216.86 No 17-Feb 3-Mar $ 72.11 Yes 21-Feb 10-Mar $ 273.03 Yes…
- Listed below is a company's sales in the period 2000 to 2011 along with the national income of the country, where the business is set up. Year National Income (in millions of $) Company's sales (in thousands of $) 2000 305 470 2001 316 485 2002 358 499 2003 350 515 2004 375 532 2005 392 532 2006 400 556 2007 398 576 2008 430 583 2009 456 587 2010 578 601 2011 498 605 Consider the following as the estimated regression analysis using excel that could be used to estimate the company's yearly sales, given the yearly national income. What is the estimated regression equation that can be used to predict the company's sales using the national income? a. y^=328.9817+0.534x b. y^=0.534+328.9817x c. y=328.9817+0.534x d. y=0.534+328.9817xAll companies are rightly concerned about the income disparity between Males and Females and FringeTech is no different. Is there any evidence in the data that Males are earning more than Females on average? Gender Income ($000) F 94.1 F 69.4 F 81.7 F 72.1 F 90.1 F 84.4 F 77.5 F 124 F 71.2 F 72.1 F 75.7 F 79.8 F 76.7 F 65.1 F 83.8 F 85.8 F 70.6 F 93.3 F 80.1 F 80.8 F 85.5 F 62.1 F 88.5 F 88.2 F 110.3 F 124.6 F 97.6 F 82.4 F 58.2 F 75.5 F 75.1 F 70.5 F 83.9 F 95.5 F 150.2 F 84.4 F 88.7 F 135.4 F 72.3 F 65.5 F 80.3 F 136.8 F 75.8 F 47.5 F 86.6 F 64.4 F 99.3 F 40 F 69.1 F 107.7 F 74.7 F 90.3 F 82.2 F 97 F 125.3 F 111.1 F 60.4 F 102.7 F 89 F 69.4 F 61.6 F 93.1 F 87.2 F 67.7 F 130.6 F 83.2 F 50.4 F 132.7 F 69.1 F 103.6 F 80.2 F 73.9 F 56.3 F 130.2 F 80.7 M 83.1 M 95.4 M 128.2 M 127.3 M 96.8 M 94 M 125.5 M 107.2 M 92.4 M…Mr. William Profit is studying companies going public for the first time. He is particularly interested in the relationship between the size of the offering and the price per share. A sample of 15 companies that recently went public revealed the following information. Size Price Size Price ($ millions), per Share, ($ millions), per Share, Company x y Company x y 1 9.0 10.8 9 160.7 11.3 2 94.4 11.3 10 96.5 10.6 3 27.3 11.2 11 83.0 10.5 4 179.2 11.1 12 23.5 10.3 5 71.9 11.1 13 58.7 10.7 6 97.9 11.2 14 93.8 11.0 7 93.5 11.0 15 34.4 10.8 8 70.0 10.7 Click here for the Excel Data File a. Determine the regression equation. (Round your answers to 4 decimal places.) b-1. State the decision rule for 0.05 significance level: H0: β ≤ 0; H1: β > 0. (Round your answer to 3 decimal places.) b-2. Compute the value of the test statistic. (Round your…
- Q3The following information was recorded in a toy store: Year 2016 Year 2017 Year 2018 Price Quantity Price Quantity Price Quantity Slime 6 50 9 60 10 56 Sticky tact 2 100 2 105 2 120 Stinky egg 4 60 4 50 6 60 Teddy Bear 10 30 11 26 12 24 Tortoise 8 40 11 39 12 36 Q3The following information was recorded in a toy store: (a) By using the above data, compute the Laspeyres Price Index for year 2018 by using year 2016 as base year. (b) Interpret your answer in part (a)). (c) By using the above data, compute the Paasche Price Index for year 2018 by using year 2016 as base year. (d) Which item has experienced the greatest inflation rate from year 2017 to year 2018? (Just state your answer, no calculation is needed in part (d)).Second, the researcher wishes to use graphical descriptive methods to present summaries of the data on each of the two variables: hours worked per week and yearly income, as stored in file HOURSWORKED.xls. Hours Per Week Yearly Income ('000's) 18 43.8p 13 44.5 18 44.8 25.5 46.0 11.5 41.2 18 43.3 16 43.6 27 46.2 27.5 46.8 30.5 48.2 24.5 49.3 32.5 53.8 25 53.9 23.5 54.2 30.5 50.5 27.5 51.2 28 51.5 26 52.6 25.5 52.8 26.5 52.9 33 49.5 15 49.8 27.5 50.3 36 54.3 27 55.1 34.5 55.3 39 61.7 37 62.3 31.5 63.4 37 63.7 24.5 55.5 28 55.6 19 55.7 38.5 58.2 37.5 58.3 18.5 58.4 32 59.2 35 59.3 36 59.4 39 60.5 24.5 56.7 26 57.8 38 63.8 44.5 64.2 34.5 55.8 34.5 56.2 40 64.3 41.5 64.5…The table below shows 2010 census data on Ubekizakhan with the population of women and the number of births to these women by different age groups;Age of Women Number of Women Number of Children15-19 28568 522020-24 314375 1266825-29 335856 2509030-34 401619 3148935-39 388074 1343840-44 346058 227145-49 301362 78 Assuming the country’s sex ratio at birth was 82 males per 79 females, compute the following; i) General fertility rate ii) Age-specific fertility rate iii) Total fertility rate iv) Gross reproduction rate v) Plot a graph showing the age-specific fertility rate (ASFR) in Ubekizakhan and explain the variations.
- The data on profit and market capitalization for a sample of 15 different firms in Metro Manila are as below. Profits (In millions Pesos) y Market ( In millions Pesos) x 296.2 1936.9 -25 1171.8 4085 55135.8 6558 97417.2 12525 95198.9 3394 53579.7 442.8 12466.3 633.1 8894.3 3528 65872.4 2698 25661.3 1200.65 19854.7 11.987 195643.8 641.8 10447.8 5043 66695.5 5206 53558.4 Develop a scatter chart for the above data. What does this chart indicate about the relationship between market capitalization and profit? Use the data to develop an estimated regression equation that could be used to estimate a firm’s profit based on its market capitalization. What is the estimated regression model? What is the predicted profit for the market capitalization of 70721.3 (In million Pesos)?A certain manufacturing company has the following data on quantities shipped and unit costs for each of its four products. Products Base-PeriodQuantities (Year 1) Mean Shipping Costper Unit ($) Year 1 Year 5 A 2,000 10.50 15.90 B 5,000 16.25 32.00 C 6,500 12.20 16.40 D 2,500 20.00 35.50 Use the price data to compute a Paasche index for the shipping cost if year 5 quantities are 4,500, 3,000, 7,500, and 3,000 for products A, B, C, and D, respectively. (Round your answer to the nearest integer.) I5 = ??The following is two years monthly sales data of 5different outlets of a well-known textile brand. You are required to perform the analysis and answer the questions given below. Brand Sales in million Rs. A 41 40 24 44 33 37 35 28 39 33 30 25 39 33 31 31 B 31 33 48 50 41 48 57 46 50 36 38 38 43 47 36 57 C 53 51 44 56 49 47 59 54 50 55 59 49 40 47 55 47 41 47 D 52 58 54 57 58 39 53 56 56 60 46 54 57 57 63 48 58 56 55 64 54 52 E 44 68 68 69 60 63 57 56 53 60 61 66 70 72 62 57 70 72 55 70 64 63 Develop the ANOVA table for the calculation of “f distribution” value. Find out the two critical values of “f distribution”.


