When should I use the X2 Goodness-of-fit test (numerical data to compare with discrete probability distribution)? Remember that some tests, such as chi squared, can be used under various circumstances. The goal of the test changes based on the situation. Pay attention to the specific conditions noted in parenthesis to ensure you are picking the correct goal. A. Compares numerical data to a known mean. The null hypothesis is that the mean of the data equals the known mean. B. Test the fit of the normal distribution to the data set. C. Compare two treatment groups of independent samples where the data meet the assumption that the data fit the normal distribution. D. Test to compare frequency data to a specific population model E. Compare two treatment groups consisting of independent samples with a normal distribution AND unequal variance. F. Compare two treatments consisting of paired data where a normal distribution can be assumed. G. Test if the median of a data set equals a null hypothesized value when the distribution of the data does not meet the assumption of normalacy. H. More than two treatment groups where a normal distribution can be assumed. O I. Compare two treatment groups when a normal distribution cannot be assumed. O J. Test to see if the frequency data from a population fit a discrete probability distribution. K. Compare categorical frequency data with an expected population proportion. No difference between observed and expected proportions is used as the null hypothesis. L. Compare more than two treatment groups when a normal distribution cannot be met. M. Compare two treatment groups consisting of paired data when the data do not fit the normal distribution.
When should I use the X2 Goodness-of-fit test (numerical data to compare with discrete probability distribution)? Remember that some tests, such as chi squared, can be used under various circumstances. The goal of the test changes based on the situation. Pay attention to the specific conditions noted in parenthesis to ensure you are picking the correct goal. A. Compares numerical data to a known mean. The null hypothesis is that the mean of the data equals the known mean. B. Test the fit of the normal distribution to the data set. C. Compare two treatment groups of independent samples where the data meet the assumption that the data fit the normal distribution. D. Test to compare frequency data to a specific population model E. Compare two treatment groups consisting of independent samples with a normal distribution AND unequal variance. F. Compare two treatments consisting of paired data where a normal distribution can be assumed. G. Test if the median of a data set equals a null hypothesized value when the distribution of the data does not meet the assumption of normalacy. H. More than two treatment groups where a normal distribution can be assumed. O I. Compare two treatment groups when a normal distribution cannot be assumed. O J. Test to see if the frequency data from a population fit a discrete probability distribution. K. Compare categorical frequency data with an expected population proportion. No difference between observed and expected proportions is used as the null hypothesis. L. Compare more than two treatment groups when a normal distribution cannot be met. M. Compare two treatment groups consisting of paired data when the data do not fit the normal distribution.

Chapter9: Sequences, Probability And Counting Theory
Section9.7: Probability
Problem 1SE: What term is used to express the likelihood of an event occurring? Are there restrictions on its...

Related questions
Question
100%
please highlight the correct answer
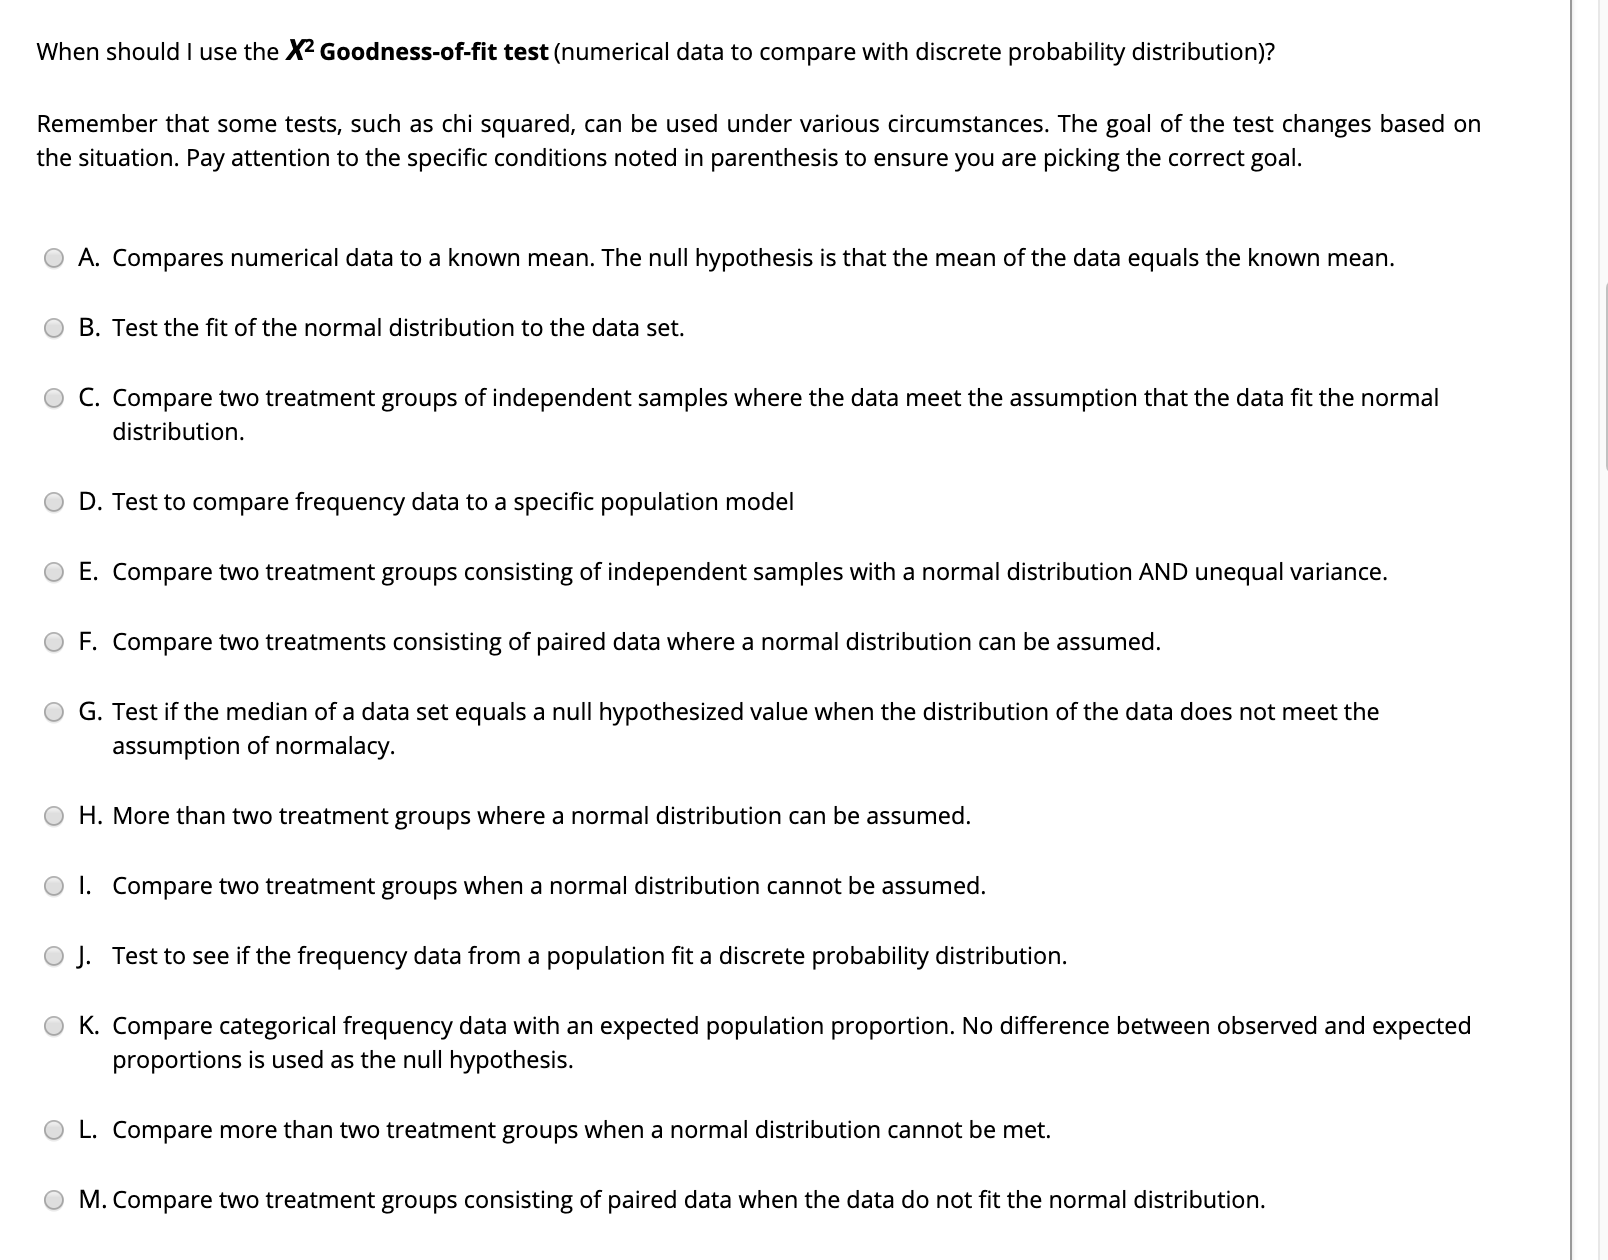
Transcribed Image Text:When should I use the X2 Goodness-of-fit test (numerical data to compare with discrete probability distribution)?
Remember that some tests, such as chi squared, can be used under various circumstances. The goal of the test changes based on
the situation. Pay attention to the specific conditions noted in parenthesis to ensure you are picking the correct goal.
A. Compares numerical data to a known mean. The null hypothesis is that the mean of the data equals the known mean.
B. Test the fit of the normal distribution to the data set.
C. Compare two treatment groups of independent samples where the data meet the assumption that the data fit the normal
distribution.
D. Test to compare frequency data to a specific population model
E. Compare two treatment groups consisting of independent samples with a normal distribution AND unequal variance.
F. Compare two treatments consisting of paired data where a normal distribution can be assumed.
G. Test if the median of a data set equals a null hypothesized value when the distribution of the data does not meet the
assumption of normalacy.
H. More than two treatment groups where a normal distribution can be assumed.
O I. Compare two treatment groups when a normal distribution cannot be assumed.
O J. Test to see if the frequency data from a population fit a discrete probability distribution.
K. Compare categorical frequency data with an expected population proportion. No difference between observed and expected
proportions is used as the null hypothesis.
L. Compare more than two treatment groups when a normal distribution cannot be met.
M. Compare two treatment groups consisting of paired data when the data do not fit the normal distribution.
Expert Solution
This question has been solved!
Explore an expertly crafted, step-by-step solution for a thorough understanding of key concepts.

This is a popular solution!

Trending now
This is a popular solution!

Step by step
Solved in 3 steps with 1 images

Knowledge Booster


Learn more about
Need a deep-dive on the concept behind this application? Look no further. Learn more about this topic, statistics and related others by exploring similar questions and additional content below.Recommended textbooks for you