Q: What are the future climate changes that may occur?
A: Introduction Climate refers to a region's long-term weather pattern, which is typically averaged…
Q: If people stopped emitting CO2 next year, do you think that global temperature would begin to…
A: Green house effect is the process in which the harmful radiations from the surface of the earth gets…
Q: ecological disaster
A: A disaster is a sudden accident or a natural catastrophe that causes great damage or loss of life.…
Q: How does the evolution of the ocean basins affect the hydrologic cycle
A: Ocean basins are formed initially by stretching and splitting of continental crust and rise of…
Q: If the rocky, sandy, or muddy intertidal zones represent such a challenging mix of environmental…
A: Different types of ecosystem has different types of fundamental keys to them. Each factor plays an…
Q: Do you think that the average annual global temperature and carbon dioxide levels have been…
A: According to the question, we have to explain that the average annual global temperature and carbon…
Q: true or false Sea level is higher during an ice age than an interglacial.
A: Interglacial period is that warm period which occurs in between the glacial (frozen period) periods.…
Q: Who owns the ocean and sea floor?
A: The oceans have no apparent surface characteristics it is flat and briny expanse. A single ocean…
Q: How does climate change affect the environment?
A: Long term pattern of weather in a region is called climate. Air temperature and precipitation…
Q: What geologic resource exist in the ocean?
A: Marine geology is responsible for focusing on areas that are affected by the oceans which will…
Q: uestion 5 The climate is drier on the downward (leeward) side of mountain ranges that are subject to…
A: The leeward side has a dry and warm climate in contrast to the moist windward side of a mountain.…
Q: Are the climatic changes we are currently experiencing "the new normal". Explain.
A: Introduction: The greenhouse effect and global warming produce a rise in body temperature of the…
Q: ht changes i
A: A long-term change in the average weather patterns that have come to define Earth's local, regional…
Q: Why do you think eruptions of volcanoes like Mt. Pinatubo might have a cooling effect on the Earth’s…
A: Introduction A volcano is a break in a planetary-mass object's crust that permits hot lava, volcanic…
Q: Which of the climate change factors listed below is NOT caused by warming temperatures?
A: Global warming is the long-term warming of Earth's climate system that has been seen from the…
Q: Calculate the average sea level rise for each year and fill in the table above.
A: Sea level rise is the increase in the level of oceans of the world. The global rise in the sea level…
Q: Use the figure showing the glaciological year to outline how increasing average temperatures impact…
A: Pressure melting point is defined as the temperature at which ice begins to melt under a given…
Q: Considering the human connection to hydrologic changes, how will climate change affect the main…
A: Changes in the hydrological systems means that a water cycle describes how water evaporates from the…
Q: What will be the quantitative effects of feedbacks such as the release of methane and carbon dioxide…
A: Permafrost is also known by the name of frozen grounds. Permafrost is described as soil that is…
Q: What climate region is found in Churchill, Canada?
A: The climatic region of Churchill, Canada is to be determined.
Q: How does rising temperature elevate sea levels?
A: The earth is made up of 70% water. The water of the majority portion of the earth is in form of…
Q: If changes in weather patterns continue, do you think that the climate zone will be different in…
A: Climate change It is defined as the long-term shifts in temperatures and weather patterns. This…
Q: is the rate of seafloor spreading farly constant? how do you know
A: Seafloor spreads at the mid-oceanic ridge due to volcanic activity, as a result, divergent boundary…
Q: rocks abiotic or biotic?
A: Abiotic factors are those factors which are not living. They are non living factors which are…
Q: What impacts would be expected to water supplies or other hydrologic features such groundwater…
A: The oceans cover 70% of the Earth's surface, & these massive reservoirs constantly exchange…
Q: According to the data shown in the map, which state is experiencing the most severe overall declines…
A: The above map shows changes in Ogallala aquifer water levels from the historical level to the year…
Q: What happens to the environment if sea ice melts?
A: Global warming is the increase in temperature due to emissions of greenhouse gases.
Q: Which part of the intertidal zone has the greatest biomass (amount of living organisms)?
A: The intertidal zone is the area where the ocean meets the land between high and low tides.…
Q: Why is the climate in northern Europe milder than the climate in Canada at the same lati- tude…
A: Question - Why is the climate in northern Europe milder than the climate in Canada at the same…
Q: Which is the main factor of desertification?
A: Desertification refers to the ongoing destruction by climatic changes and human activity of dryland…
Q: how can a layer chicken adapt to the anticipated temperature rise(global temperature)
A: Global temperature is the rise in temperature worldwide due to global warming. This may lead to heat…
Q: What are the steps in the process of seafloor spreading?
A: Seafloor spreading is the process by which new oceanic crust is formed by the upwelling of magma…
Q: At a subduction zone, what causes magma to rise?
A:
Q: If the climate zone was to change in Texas, what zone do you think it will change to, and why? If…
A: Hi dear, here's your answer. Climate change is creating Texas hotter, threatening public health,…
Q: What is the micro-climate zone of North Carolina?
A: Introduction: A microclimate is a small region within a larger area that has a different climate…
Q: What is the water pressure in the deepest ocean trenches?
A: Pressure increases down the depth, it can be up to eight tons per square inch or equivalent to 1000…
Q: The graph shows that the atmosphere is currently warmer than it has been in Global Mean Temperature…
A: We know that the planet Earth had been formed from the Big Bang. Since then, species of plants and…
Q: What happened with the climate of Tanzania between 1960 and 1975?
A: The climate of Tanzania changes regularly, the temperature is between 10oC-20oC in winters and…
Q: During glacial periods of the Pleistocene, the climate in Africa became…
A: Glacial period is the period where glacial advancements occur. Answer is Option d( More arid) and…
Q: How does subduction cause the formation of land mass like mountains and volcanoes?
A: Subduction is a process in which tectonic plates slide beneath each other and merge with the mantle…
Q: how much has the global surface temperature changed since 1970 (compared to the 1951-1980 average)?
A: Temperature is the degree of hotness or coldness of an object.
Q: What is the water temperature near deep sea vents, and how does that compare to the “normal” water…
A: There is a huge difference in the temperature at different depths of the oceans. The organisms…
Q: How has the Earth changed under previous climatic events? What evidence from natural climate…
A: Earth's climate has changed dramatically many times since the planet was formed 4. 5 billion years…
When was the last time sea surface temperatures were below the 20th century average?
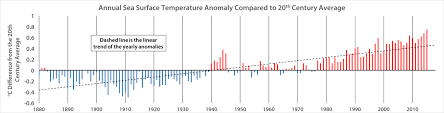
Trending now
This is a popular solution!
Step by step
Solved in 2 steps
- London, England, is at the same latitude as Calgary in Canadas province of Alberta. However, the mean January temperature in London is 5.5C (42F), whereas in Calgary it is minus 10C (14F). Compare the locations of these two cities, and suggest a reason for this temperature difference.AtmosphericCO2 concentrations began their most recent steep increase about:a.5000 B.C.b.1000 B.C.c.1400 A.D.d.1800 A.D.e.1950 A.D.Biome Type Temperature (C) Precipitation (mm) Desert 8.6 74 Grassland 2.9 416 Boreal forest –0.3 643 Arctic tundra –4.1 480 Rain forest 19.7 1350 Temperate forest 4.3 810 graph the biomes from wettest to driest graph the biomes from hottest to coldest
- Due to Global Warming, the average temperature of the world increased by ______________ a) 0.75 c b) 14 F c) 0.75 F d) -19 cHere is some data about sea level rise in the Chesapeake Bay. The data shows the change in sea level over time. Notice that there are four sea level measurements per year because they are done during each season (fall, winter, summer, and spring). Sea Level Rise Year 0.5 mm 1980 0.4 mm 1980 0.4 mm 1980 0.2 mm 1980 Average 0.6 mm 1990 0.4 mm 1990 0.8 mm 1990 0.5 mm 1990 Average 0.5 mm 2000 0.6 mm 2000 0.9 mm 2000 0.8 mm 2000 Average 0.9 2010 0.8 2010 1.0 2010 1.3 2010 Average Calculate the average sea level rise for each year and fill in the table above. Now create an Excel graph (or use some graphing software) to portray the data from the table above. Insert the graph below. According to the data how is the sea level rise changing over time? Make a prediction for the 2020 measurements. What do you expect to see…Death Valley recorded one of its hottest days this past summer at 128F - it thought to be the highest ever recorded! However, there is some controversy as the temperature there sometime in the summer of 2002 was 56C. Which year was hotter, 2002 or 2020?
- Sea Temperature To predict the effect of El Nio or La Nia events in the future, the National Oceanographic and Atmospheric Administration collects information about sea surface temperature (SST) and atmospheric conditions. They compare monthly temperature averages in the eastern equatorial Pacific Ocean to historical data and calculate the difference (the degree of anomaly) to determine if El Nio conditions, La Nia conditions, or neutral conditions are developing. El Nio is a rise in the average SST above 0.5C. A decline of the same amount is La Nia. FIGURE 47.8 shows data for 42 years. FIGURE 47.8 Sea surface temperature anomalies (difference from the historical mean) in the eastern equatorial Pacific Ocean. A rise above the dashed red line is an El Nio event, a decline below the blue line is La Nia What type or conditions were in effect in the fall of 2007 when California suffered severe wildfires?Sea Temperature To predict the effect of El Nio or La Nia events in the future, the National Oceanographic and Atmospheric Administration collects information about sea surface temperature (SST) and atmospheric conditions. They compare monthly temperature averages in the eastern equatorial Pacific Ocean to historical data and calculate the difference (the degree of anomaly) to determine if El Nio conditions, La Nia conditions, or neutral conditions are developing. El Nio is a rise in the average SST above 0.5C. A decline of the same amount is La Nia. FIGURE 47.8 shows data for 42 years. FIGURE 47.8 Sea surface temperature anomalies (difference from the historical mean) in the eastern equatorial Pacific Ocean. A rise above the dashed red line is an El Nio event, a decline below the blue line is La Nia During a La Nia event, less rain than normal falls in the American West and Southwest. In the time interval shown, what was the longest interval without a La Nia event?Sea Temperature To predict the effect of El Nio or La Nia events in the future, the National Oceanographic and Atmospheric Administration collects information about sea surface temperature (SST) and atmospheric conditions. They compare monthly temperature averages in the eastern equatorial Pacific Ocean to historical data and calculate the difference (the degree of anomaly) to determine if El Nio conditions, La Nia conditions, or neutral conditions are developing. El Nio is a rise in the average SST above 0.5C. A decline of the same amount is La Nia. FIGURE 47.8 shows data for 42 years. FIGURE 47.8 Sea surface temperature anomalies (difference from the historical mean) in the eastern equatorial Pacific Ocean. A rise above the dashed red line is an El Nio event, a decline below the blue line is La Nia What type of event, if any, occurred during the winter of 19821983? What about the winter of 20012002?
- Sea Temperature To predict the effect of El Nio or La Nia events in the future, the National Oceanographic and Atmospheric Administration collects information about sea surface temperature (SST) and atmospheric conditions. They compare monthly temperature averages in the eastern equatorial Pacific Ocean to historical data and calculate the difference (the degree of anomaly) to determine if El Nio conditions, La Nia conditions, or neutral conditions are developing. El Nio is a rise in the average SST above 0.5C. A decline of the same amount is La Nia. FIGURE 47.8 shows data for 42 years. FIGURE 47.8 Sea surface temperature anomalies (difference from the historical mean) in the eastern equatorial Pacific Ocean. A rise above the dashed red line is an El Nio event, a decline below the blue line is La Nia When did the greatest positive temperature deviation occur during this time period?A rain shadow is a reduction in rainfall ________. a. on the inland side of a coastal mountain range b. during an El Nio event c. that results from global warmingThe _______________ is open ocean from the shoreline to a depth of 200 m. (a) benthic environment (b) intertidal zone (c) neritic province (d) oceanic province (e) aphotic region