When working with a sample of size 28, find the area under a t-curve: (a) Above -0.4. ANSWER: (b) Below -1.8. ANSWER: (c) Between -0.8 and 0.7 ANSWER: Hint: You may need to find and use a different t-table with t-values for larger upper tail areas.
When working with a sample of size 28, find the area under a t-curve: (a) Above -0.4. ANSWER: (b) Below -1.8. ANSWER: (c) Between -0.8 and 0.7 ANSWER: Hint: You may need to find and use a different t-table with t-values for larger upper tail areas.

Glencoe Algebra 1, Student Edition, 9780079039897, 0079039898, 2018
18th Edition
ISBN:9780079039897
Author:Carter
Publisher:Carter
Chapter10: Statistics
Section10.6: Summarizing Categorical Data
Problem 31PPS

Related questions
Question
100%
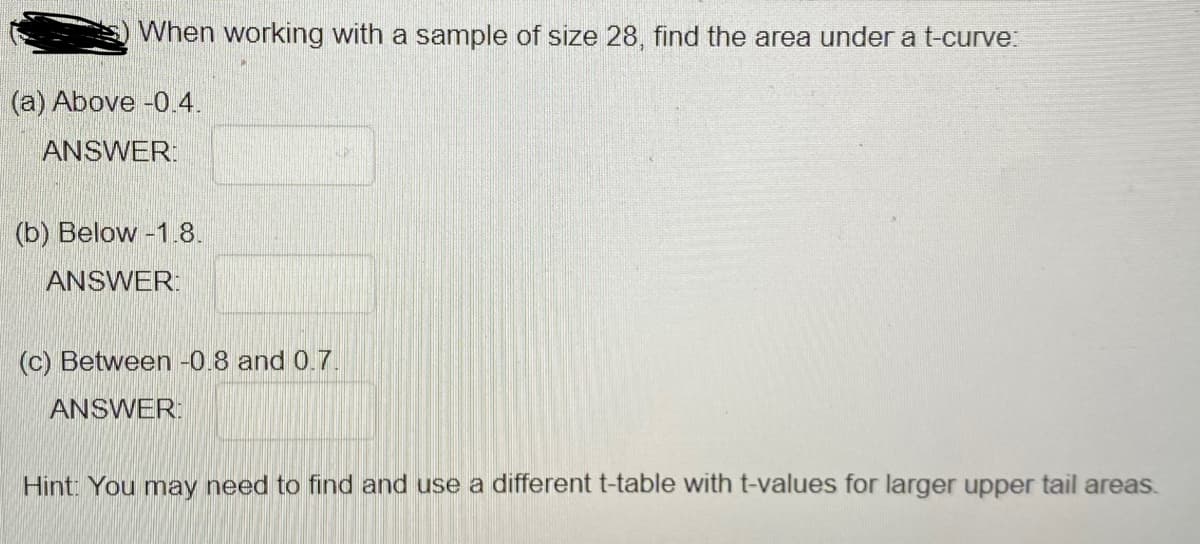
Transcribed Image Text:When working with a sample of size 28, find the area under a t-curve:
(a) Above -0.4.
ANSWER:
(b) Below -1.8.
ANSWER:
(c) Between -0.8 and 0.7.
ANSWER:
Hint: You may need to find and use a different t-table with t-values for larger upper tail areas.
Expert Solution
This question has been solved!
Explore an expertly crafted, step-by-step solution for a thorough understanding of key concepts.

This is a popular solution!

Trending now
This is a popular solution!

Step by step
Solved in 2 steps with 2 images

Recommended textbooks for you
Glencoe Algebra 1, Student Edition, 9780079039897…
Algebra
ISBN:
9780079039897
Author:
Carter
Publisher:
McGraw Hill
Glencoe Algebra 1, Student Edition, 9780079039897…
Algebra
ISBN:
9780079039897
Author:
Carter
Publisher:
McGraw Hill