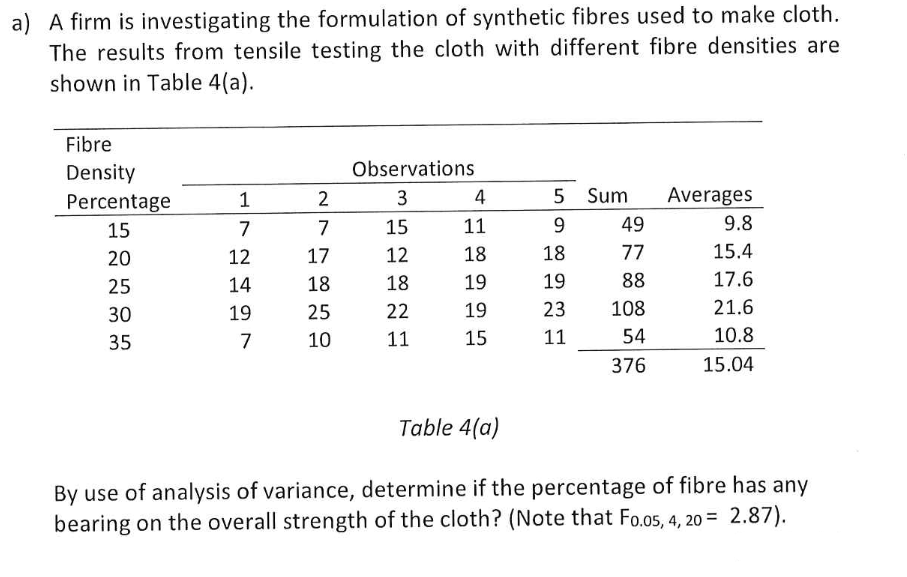
A firm is investigating the formulation of synthetic fibres used to make cloth. The results from tensile testing the cloth with different fibre densities are shown in Table 4(a). Fibre Density Observations Percentage 1 3 4 5 Sum Averages 2.


Q: For the stem and leaf given below, determine the following: 1. P10, 2. Standard deviation
A: For the given stem and leaf , we need to determine the following: 1. P10, 2. Standard deviation
Q: of 232.3-cm and a standard deviation of 1.6-cm. For shipment, 21 steel rods are bundled together.…
A: Given Data : Population Mean,μ = 232.3 Population Standard Deviation,σ = 1.6 sample size…
Q: A bank auditor claims credit card balances are normally distributed, with a mean of $3,500 and a…
A:
Q: ample 8•10. A computer while calculating correlation coefficient between two variables X and Y from…
A: Given that We have to find the corrected correlation coefficient
Q: Consider a population with μ=66.6 and σ=8.1 is taken. Find the standard deviation of the sampling…
A:
Q: Listed below are the numbers of triplets born in a country each year beginning with 1995. Is there a…
A: Time series graph is plotting the data in a time (or) chronological order, to detect whether the…
Q: Let X be the random variable from normal distribution with mean (μ) = 60 and standard deviation (σ)…
A:
Q: Correlation Results Fifty-four college students were surveyed. The distance each student lived from…
A: The question is based on a testing of a popl. correlation coefficient Given : Level of signif. ( α )…
Q: 19. Show that the value of yo when та mx dp = yoe 1 += a dx, - a sx<o∞ gives probability density…
A:
Q: Suppose we are interested in the proportion of statistics students at this university who are…
A: Given, Total no. of students, n = 10 No. of favorable cases, x = 3 Sample proportionp^=xn=310=0.3,
Q: Use the given data to find the equation of the regression line. Examine the scatterplot and identify…
A: For the given data Find the regression line Select the correct choice
Q: Find the (a) mean, () median, (c) mode, and (6) midrange for the cata and then (e) answer the given…
A: For the given data Find mean =? median =? mode =?
Q: Which of the following is NOT true about statistical graphs? Choose the correct answer below. A.…
A: Volume is 3 dimensional while the rectangle is two dimensional.
Q: Complete the following ANOVA summary table: SOURCE SUMS OF SQUARES DF MS (VARIANCE) F…
A: Formula : SST = SSB+SSE dfT = dfB + dfE MSB = SSB/dfB MSE = SSE/dfE F = MSB/MSE
Q: Find the mean of the set: {9, 14, 9, 4, 14}
A: Solution:- Given data 9, 14, 9, 4, 14
Q: A researcher collected data on ( X , Y ), and wanted to test if the true relationship is linear.…
A: To test whether true relationship is linear or not, consider Lack of fit F-test. H0: There is no…
Q: The graph illustrates a normal distribution for the prices paid for a particular model of HD…
A: We have given that, From the normal curve, Population mean (μ) = 1600 and standard deviation (σ) =…
Q: The prices (in dollars) for a particular model of digital camera with 6.0 megapixels and an optical…
A: For the given data n =10 ,alpha =0.05
Q: What are the benefits of researchers and students utilizing secondary analysis
A: One of the major benefits of using secondary analysis is that it is cost effective. There is no need…
Q: The mean and standard deviation of the diameters of a sample of 238 rivet heads manufactured by a…
A:
Q: Suppose we are interested in the proportion of statistics students at this university who are…
A: No. of statistics students who took the survey=10 No. of statistics students who marked 'Commerce'…
Q: Match these values of r with the accompanying scatterplots: 0.34, 0.689, – 1, - 0. - 0.689. Click…
A: Correlation A correlation tells the relationship between two factors that do not have a causal…
Q: There is a proposed plan to close down the center of the town for cars and making it accessible only…
A: Given that 518 people were polled and 233 said that they agree with the plan. Does this outcome…
Q: When the socioeconomic (SES) and health variables are added in Model 2, is there evidence that they…
A: 1. In model 1, the coefficient of Race/Ethnicity has p-value < 0.001, meaning that in model 1…
Q: weight of 450kg with a variance of 70. A sample of 149 female lions had an average weight of 250kg…
A:
Q: Conduct a test (at an alpha of .05) to answer whether or not San Angelonian’s salary is…
A:
Q: A health psychologist claims that the more final exams a student has during finals weeks, the more…
A: We need to compute the mean difference for the given data.
Q: In a random sample of 100 men in the United States, 55 of them were married. Using a 95% confidence…
A:
Q: A chord of a circle of radius a is drawn parallel to a given straight line, all distances from the…
A:
Q: 120 shoppers are intercepted in several shopping malls in Westchester county to complete a cell…
A: Proportionate stratified sampling.
Q: The accompanying table gives amounts of arsenic in samples of brown rice from three different…
A: There are 3 independent samples which are Arkansas, California and Texas. We have to test whether…
Q: 1) Scores for a mathematics competition for a large population of students are normally distributed…
A: The provided information is µ=9.44 σ=1.75 a.…
Q: 3. Use the t-distribution table to determine the value of t to construct confidence interval for the…
A: Hello! As you have posted more than 3 sub parts, we are answering the first 3 sub-parts. In case…
Q: = .7 and p, = .6. Test Ho: (P, – P2) =0 against Ho: (P, - P2) >0 using. .05 a =
A: Hypothesis testing about the difference between two population proportions is otherwise called…
Q: 10. The SAT is one of two major college aptitude tests that is taken. The mean composite score is…
A: The question is based on a normal dist. Given : The mean composite score ( μ ) = 1060 The std.…
Q: An examinee of the National Medical Admission Test (NMAT) got a percentile rank of 95%. What does…
A: An examinee gives a National Medical Admission Test(NMAT) and got a percentile rank of 95% in it.
Q: The last digit of the heights of 61 statistics students were obtained as part of an experiment…
A: Given that, the last digit of the heights of 61 statistics students were obtained as part of an…
Q: Suppose that a brand of lightbulb lasts on average 1722 hours with a standard deviation of 200…
A: Solution-: Given: μ=1722,σ=200 We want to find, P(1202<X<1958)=?
Q: An insurance manager believes that the number of new policies written annually by his agents is…
A: Since you have posted a question with multiple sub-parts, we will solve first three sub- parts for…
Q: Assume that a randomly selected subject is given a bone density test. Those test scores are normally…
A:
Q: 3. MAKE A NEWTON'S DIVIDED DIFFERENCE TABLE TO (a) FIND FOR THE FUNCTION f,(x) THAT WILL SATISFY THE…
A: We need to make a Newton's divided difference table to find: (a) the function f(x) (b) f(4) and…
Q: SA Today/CNN/Gallup survey of 375 working parents found 200 who said they spend too little tim What…
A: Given X=200 n=375
Q: which of the following most closely approximates the obtained t-value? A. 0.27 B. 1.00 C.…
A: We have given that Mean, MD = 5 Sample standard deviation, s = 8 Sample size, n = 4
Q: Please specify the key problem with this question included in a questionnaire: "When using the…
A: Given Question: "When using the Internet, do you pay attention to some of the ads?" The objective…
Q: 1- İn order to determine the proportion of defects in a shipment, 40 parts from it are randomly…
A: The shipment consists of 90 boxes. Each box contains 200 parts. Two boxes are randomly chosen and…
Q: ns with the same mean. Do the amounts of arseni ve the highest mean, can we conclude that brown k…
A: Given, Arkansas California Texas 4.84 1.45 5.55 4.87 3.7 5.81 5.02 3.96 6.62 5.41 4.47…
Q: The accompanying data are the weights (kg) of poplar trees that were obtained from trees planted in…
A: (a) State the hypotheses.
Q: Select all the statistical functions that are part of PostGis 2.1 : ST_Histogram…
A: PostGis 2.1: It is an open and free software used as an extender for PostgreSQL. PostgreSQL is a…
Q: The Human Resource department of Lala firm has summarized the number of service years of their 120…
A:
Q: The hypothesis test H0:μ1−μ2=3 H1:μ1−μ2≠3 is to be carried out for population 1 and 2 where σ1 and…
A:

Step by step
Solved in 2 steps with 1 images

- How sensitive to changes in water temperature are coral reefs? To find out, scientists examined data on sea surface temperatures, in degrees Celsius, and mean coral growth, in centimeters per year, over a several‑year period at locations in the Gulf of Mexico and the Caribbean Sea. The table shows the data for the Gulf of Mexico. Sea surface temperature 26.726.7 26.626.6 26.626.6 26.526.5 26.326.3 26.126.1 Growth 0.850.85 0.850.85 0.790.79 0.860.86 0.890.89 0.920.92 (b) Find the correlation ?r step by step. Round off to two decimals places in each step. First, find the mean and standard deviation of each variable. Then, find the six standardized values for each variable. Finally, use the formula for ?r . Round your answer to three decimal places.Calculate the average values of the Cp and Cpk capabil-ity indices for the BOD data , assuming that LSL=5 mg/L and USL=35 mg/L. Do these val-ues of the indices indicate that the process performance is satisfactory?The spike stature of the plants grown from the seeds of the porcine separates (Dactylis glomerata L) collected from the University campus and İbradı Eynif pasture are given below. In this plant, compare whether there is a difference between regions in terms of spike height. Virgo Height (cm) Data obtained from plants collected from university campus 5 6 8 7 8 6 5 5 4 6 6 Data obtained from plants collected from Eynif pasture 12 9 11 9 9 11 9 10 11 10 Note: Your results interpretation according to two different possibilities (Do it separately, assuming that it is 0.07 and 0.04).
- The article “Withdrawal Strength of Threaded Nails” (D. Rammer, S. Winistorfer, and D. Bender, Journal of Structural Engineering 2001:442–449) describes an experiment comparing the ultimate withdrawal strengths (in N/mm) for several types of nails. For an annularly threaded nail with shank diameter 3.76 mm driven into spruce-pine-fir lumber, the ultimate withdrawal strength was modeled as lognormal with μ = 3.82 and σ = 0.219. For a helically threaded nail under the same conditions, the strength was modeled as lognormal with μ = 3.47 and σ = 0.272. a) What is the mean withdrawal strength for annularly threaded nails? b) What is the mean withdrawal strength for helically threaded nails? c) For which type of nail is it more probable that the withdrawal strength will be greater than 50 N/mm? d) What is the probability that a helically threaded nail will have a greater withdrawal strength than the median for annularly threaded nails? e) An experiment is performed in which withdrawal…Much concern has been expressed regarding the practice of using nitrates as meat preservatives. In one study involving possible effects of these chemicals, bacteria cultures were grown in a medium containing nitrates. The rate of uptake of radio-labeled amino acid (in dpm, disintegrations per minute) was then determined for each culture, yielding the following observations. 7,255 6,875 9,637 6,863 9,098 5,846 8,954 7,979 7,068 7,498 7,882 8,179 7,528 8,728 7,469 Suppose that it is known that the mean rate of uptake for cultures without nitrates is 8,000. Do the data suggest that the addition of nitrates results in a decrease in the mean rate of uptake? Test the appropriate hypotheses using a significance level of 0.10. Find the test statistic and P-value. (Use technology to calculate the P-value. Round your test statistic to two decimal places and your P-value to three decimal places.) t= P-value= State your conclusion. Reject H0. We have convincing evidence that the mean rate of…ABC Company has decided to use 20 test markets to examine the sensitivity of demand for its new product, Hand Sanitizer, to various prices, as shown in the following table. Each market had approximately the same level of business activity and population. Test Market Quantity sold (Thousands of Pens) Price Charged (cent) 1 20 50 2 21 50 3 19 55 4 18 60 5 20 60 6 14 65 7 16 65 8 20 70 9 12 70 10 14 80 11 12 70 12 10 70 13 14 65 14 16 90 15 18 45 16 16 70 17 20 65 18 12 80 19 18 70 20 10 50 Q.1. Using a linear regression model, estimate the demand function for ABC Company’s new product, Hand sanitizer. Q.2. Interpret the coefficient value of the independent variable of the estimated demand function. Q.3. What will be the predicted/estimated sale for each price shown in column 2? Q.4. Find the prediction interval at…
- A group of six, obese adult men had their weights recorded both before and 10 months after having a diet treatment to help manage their weight. Observe the information presented in the table below: The weights of six obese adult men both before and 10-months after having a diet treatment Before Diet Treatment After Diet Treatment 250 240 225 215 220 198 311 300 326 298 205 205 Test at α = 0.05 the hypothesis that for the group, there was a statistically significant average decrease in weight from before diet treatment to 10 months after. Hint: This is hypothesis testing for paired samples. Here, you will use a paired t test.In experiments to determine the effectiveness of drugs such as anti-fungal ointments that are applied to the skin, the concentration of the drug in a patient’s skin must be measured. The article “Determining Bioequivalence of Topical Dermatological Drug Products by Tape- Stripping” (W. Navidi, A. Hutchinson, et al., Journal of Pharmacokinetics and Pharmacodynamics, 2008:213–220) describes an improved method of measuring that is designed to ensure that all the drug in the skin is recovered. Assume that in an experiment using the old method, the mean amount of drug recovered from a sample of 49 patients was 105 ng with a standard deviation of 20 ng, and that in an experiment using the new method the mean amount of drug recovered in a sample of 35 patients was 117 ng with a standard deviation of 15 ng. Find a 98% confidence interval for the difference in the mean amounts recovered between the two methods.