

Q: 8. For what values of k will the set {(4,2), (5,10), (k – 1,7), (6,12)} represent a function?
A:
Q: 7. Which graph represents the linear function represented by this set of ordered pairs? (14, 10),…
A:
Q: Which of the following graphed function has the positive leading coefficient and an even degree? A…
A: The degree of a polynomial is the highest of the degrees of the polynomial's monomials with…
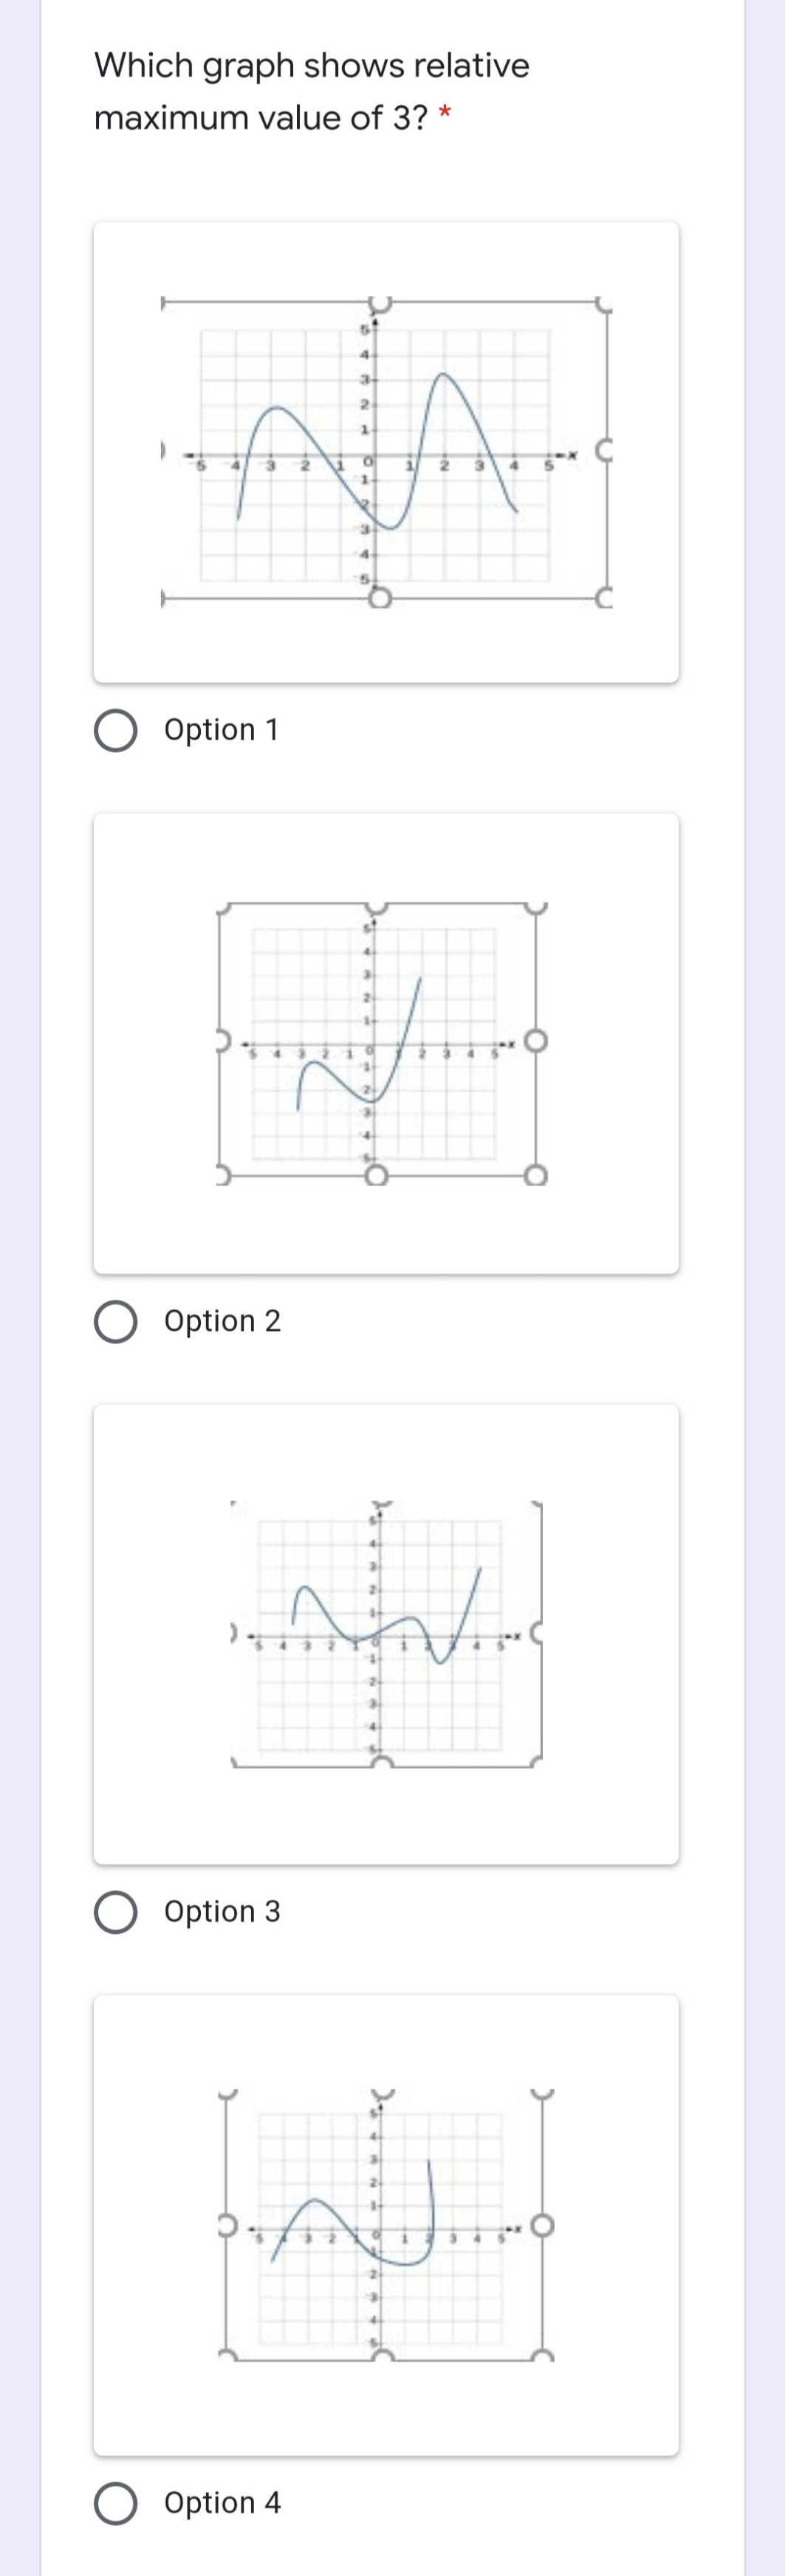
Q: Choose the letter of the correct answer. If f © = 0, then f(c) is a relative maximum or relative…
A: I am going to solve the problem by using some simple algebra to get the required result of the given…
Q: Which graph shows the graph of a linear function with Ihitla 5? O A. O B. C. O D. Ay Ay Ay -6
A: Solution: To find which of the following graph is a linear function with initial value 5?
Q: The line graph shows the goals per game average for a sporting series during the years shown. During…
A: Given graph: The line graph shows the goals per game average for a sporting series during the years…
Q: Interpret the graph the expresses at least 3 different situations (pieces such as peak points,…
A: Interpret the graph the expresses at least 3 different situations (pieces such as peak points,…
Q: (c) Where does g have a maximum and a minimum value? 2 14 minimum maximum
A:
Q: Which of the following graphs represents the region defined by the inequality y> 4x - y
A: Please see the answer below.
Q: 4. Which of these graphs models the relation {(-3, -1), (3, 1), (-3, 1), (3, –-1)}? a. b. С. -2 0 2.…
A:
Q: hat is the d
A: Given, f(x)=(0.5)(0.5)x
Q: 3. Which graph models the relation {(2, 1), (1, 2), (1, -2)}?
A: Given: The relations is {(2,1) , (1,2) ,(1,-2)} which gives that 2→1 ⇒(2,1)1→2 ⇒(1,2)1→-2…
Q: 4. Which point in the graph is the function continuous? c. 5. What interval is the graph above…
A: 4. point "d" is continuous because it left and right side values are equal to eachother and to d…
Q: Basel's weather app shows a diagram of the predicted weather and maximum temperatures for the next…
A:
Q: A function contains five points and has a range of {-4, -2, 0, 5}. If four of the five points are…
A: Answer d is correct Domain {-2,-1,1,3,5} Range {-4,-2,0,3,5}
Q: Look at the graph attatched and answer the following question: A) Find the skewness and kurtosis of…
A: Introduction - Formula of skewness Sk=1N∑xi-xσ3where ,N=total frequency σ=standard deviation…
Q: What are the critical points for the graph shown? 2. 1 543244 1 23 4 5 543 21
A:
Q: Which statement is true for the graph of f(x) = 2x³ – 6x² – 48x + 24? %3D O (4, –140) is a relative…
A:
Q: What is the minimum of this function? -8°
A: FINDING THE MINIMUM OF THE FUNCTION OF THE GRAPH
Q: Based on this graph, complete the following statement: Approximately 25% of the Drug A patients…
A: 5.d) Using the given graph of Boxplot, it can be seen that the first quartile of amount of…
Q: 4.) What is the range of this graph? The range is the lowest point on the y-axis to the highest…
A: given
Q: 40 20 -5 5 -20
A:
Q: What is the domain of the function in the graph? +20+n 48 16 4- 12 10 i23 4 5 6 7 8 O 11 < n < 16 00…
A: Given the graph of the function We have to find the domain of the function and choose the correct…
Q: 6. Is the vertex for g (x) =- (x- 4) a maximum point e on the graph or a minimum point on the graph?
A:
Q: is a relative maximum is a relative minimum 3 is a relative maximum 07 is a relative minimum
A:
Q: 3\ 10 11 12 13 14 15 16 17 Jose graphed 12 sx on the number line above. His classmate says that Jose…
A: Given Graph of x≥12 drawn by Jose.
Q: Find the absolute maximum and minimum for the given pair. 4 5
A: To find out the absolute maximum and absolute minimum.
Q: Which graph shows the function f (x) =-Inz+ 1? -2 -1
A:
Q: Give conclusions that can be drawn from the graph. Select all the conclusions that can be drawn from…
A: Given: A pie chart that shows how other drivers Irk Us.
Q: Match the graph with its inequality. hint: don't be tricked by the variable on the right. 8. 9. 10…
A: Graph of all the inequality is given in the images
Q: What function is graphed below? 14 13 10 9. -2
A:
Q: 2. Which table is related to the graph at the right? H. Temp. ("F) Time Time (h) Temp. ("F) (h) 68…
A: Note:- Since you have asked multiple question As per our policy, we will solve the first question…
Q: Are less than and greater than graphed with open circles or closed circles
A:
Q: In an orchestra, 20 people can play stringed instruments, 18 can play brass, and 14 can play…
A: Consider the possible events to create the orchestra. A : People who plays stringed instruments. B :…
Q: 4) Let f(x)=(x+3)squared−4 , give the: a) vertex b) axis c) domain d) range e) graph
A: we have been given a function y=(x+3)2-4 this can be written as (x+3)2=y+4 the given function is…
Q: 4, use the graph to find the value of the following. Round your If g(2) answers to 4 decimal places…
A: g(2)-g(0)=∫02g'(x)dxg(2)-g(0)=[Area under the graph g'(x) from x=0 to x=2]g(2)-g(0)=12*2*4…
Q: A study of 900 working women showed that their feelings changed throughout the day. The line graph…
A: For the given info :
Q: 7. Which vertex will result in the maximum value of the function T = x - 3y? O (3.5, 4) (0, 4)
A: Answer and explanation is given below..
Q: The graph of a quadratic function is known to have a vertex at (-3, 8) and passes through another…
A: Suppose h,k be the vertex of the quadratic equation, then the quadratic function is such that…
Q: What is the range of the following relation? (9, -2) (4, 3) (8, 10) ( -4, 8)
A: Given: R=9,-2, 4,3, 8,10, -4,8
Q: Which statement is true for the graph of f(x) = 2x - 6x2 – 48x + 24? - (4, –140) is a relative…
A: Topic:- application of derivatives
Q: What is the Range of the following graph? 6.
A: Consider the given graph as
Q: 58. а. а b. a b
A: Answer
Q: Mark all the relative minimum points in the graph. 5+ Click to add points 2- -7 -6 -5 -4 -3 -2 23 4…
A: Consider the given graph. We have to identify all relative minimum points in the graph. Note that,…
Q: In an orchestra, 22 people can play stringed instruments, 15 can play brass, and 12 can play…
A: In an Orchestra, 22 people can play stringed instruments, 15 can play brass, and 12 can play…
Q: The graph of æ is the solid black graph below. Which function represents the dotted graph? 10 6 10 9…
A: From red graph, we get the points (3,5) and (8,6)
Q: 36. In a sample of twenty-six trees of a particular species, wood density, D (kg/m³), is related to…
A:
Q: Which of these graphs has its maximum point on the line 3 10 10 -10 10 10
A: The derivative is defined as the rate of change of one quantity with respect to another. In order to…
Q: It is better to Select one: the data-ink ratio, when presenting data in a graph. Stabilize Maximize…
A: The answer is option 2.

Step by step
Solved in 2 steps with 2 images

- A business wants to lower its price level to increase sales of its goods. However, for the price reduction to be beneficial, the increase in sales after the price decrease must be greater than 10%. After the business lowers its prices, it monitors its sales for 60 days and determines that the rate of increase in sales is 13% on average. Should the business maintain the low price level practice? What is the hypothesis and decision for α = 0.05? H0 : P ≤ 0.13 H1 : P > 0.13, Decision: Ho cannot be rejected. H0 : P = 0.10 H1 : P < 0.10, Decision: Ho is rejected. H0 : P = 0.13 H1 : P ≠ 0.13, Decision: Ho is rejected. H0 : P = 0.10 H1 : P ≠ 0.10, Decision: Ho cannot be rejected. H0 : P ≤ 0.10 H1 : P > 0.10, Decision: Ho cannot be rejected.Which of these coordinate points lies withing the feasible region? *Please help with iv v and vi with a step by step process on how we get the optimal tableau
- URGENT PLEASE ANSWER ASAP What is the null hypothesis given the way the solid green line is drawn on the graph?A college bookstore must order books two months before each semester starts. They believe that the number of books that will ultimately be sold for any particular course is related to the number of students registered for the course when the books are ordered. They would like to develop a bestfitting line to predict how many books to order. From past records, the bookstore obtains the number of students registered, X, and the number of books actually sold for a course, Y , for 12 different semesters.A scatterplot of the data along with the best fitting line is presented below. a. The correlation between the two variables is r = .89. Calculate and interpret the value of r2.b. The equation for the best fitting line is Y = 9.30 + 0.673X. Explain and interpret the value of 9.30.c. How many books should the store order for a class of 50 students? Would you trust this prediction?a pollster wnats to minimize the effect the order of the questions has on a person's response to a survey. how many different surveys are required to cover all possible arrangements if there are 9 questions on the survey?
- The number of people initially infected is? The number of people infected after 4 weeks is? The limiting size of the infected population is ?A farmer wants to decide which of the three crops he should plant on his 100-acre farm. The profit from each is dependent on the rainfall during the growing seasons. The farmer has categorized the amount of rainfall as high, medium, low. His estimated profit for each is shown in the table. If the farmer wishes to plant only one crop, decide which will be his choice using the EQUALLY-LIKELY rule, prove your judgement by comparing the average pay-offs for each crop. (Indicate the equally-likely pay-off in each crop, comparison and the right choice).With very clear steps
- Please explain why this statement is true or false:"In the two-period model, both the Current Account and the Trade Balance in period one improve with an anticipated increase in the endowment of period two (ΔQ1=0 and ΔQ2>0)''Use equations of the optimal allocation of consumption in periods 1 and 2, the trade balance in period 1, and the current account in period 1 to support your answer.Assume the following lifetime utility function: U(C1,C2)= ln(C1) +β ln(C2) and the subjective discounting factor is 0<β<1A farmer wants to decide which of the three crops he should plant on his 100-acre farm. The profit from each is dependent on the rainfall during the growing seasons. The farmer has categorized the amount of rainfall as high, medium, low. His estimated profit for each is shown in the table. If the farmer wishes to plant only one crop, decide which will be his choice using the EQUALLY-LIKELY rule, prove your judgement by comparing the average pay-offs for each crop. (Indicate the equally likely pay-off in each crop, comparison and the right choice).The Fast Track Ski Shoppe sells ski goggles during the four months of the ski season.Average demand follows: a. Calculate the deseasonalized sales and the seasonal index for each of the fourmonths.b. If next year’s demand is forecast at 1200 pairs of goggles, what will be the forecast sales for each month?
