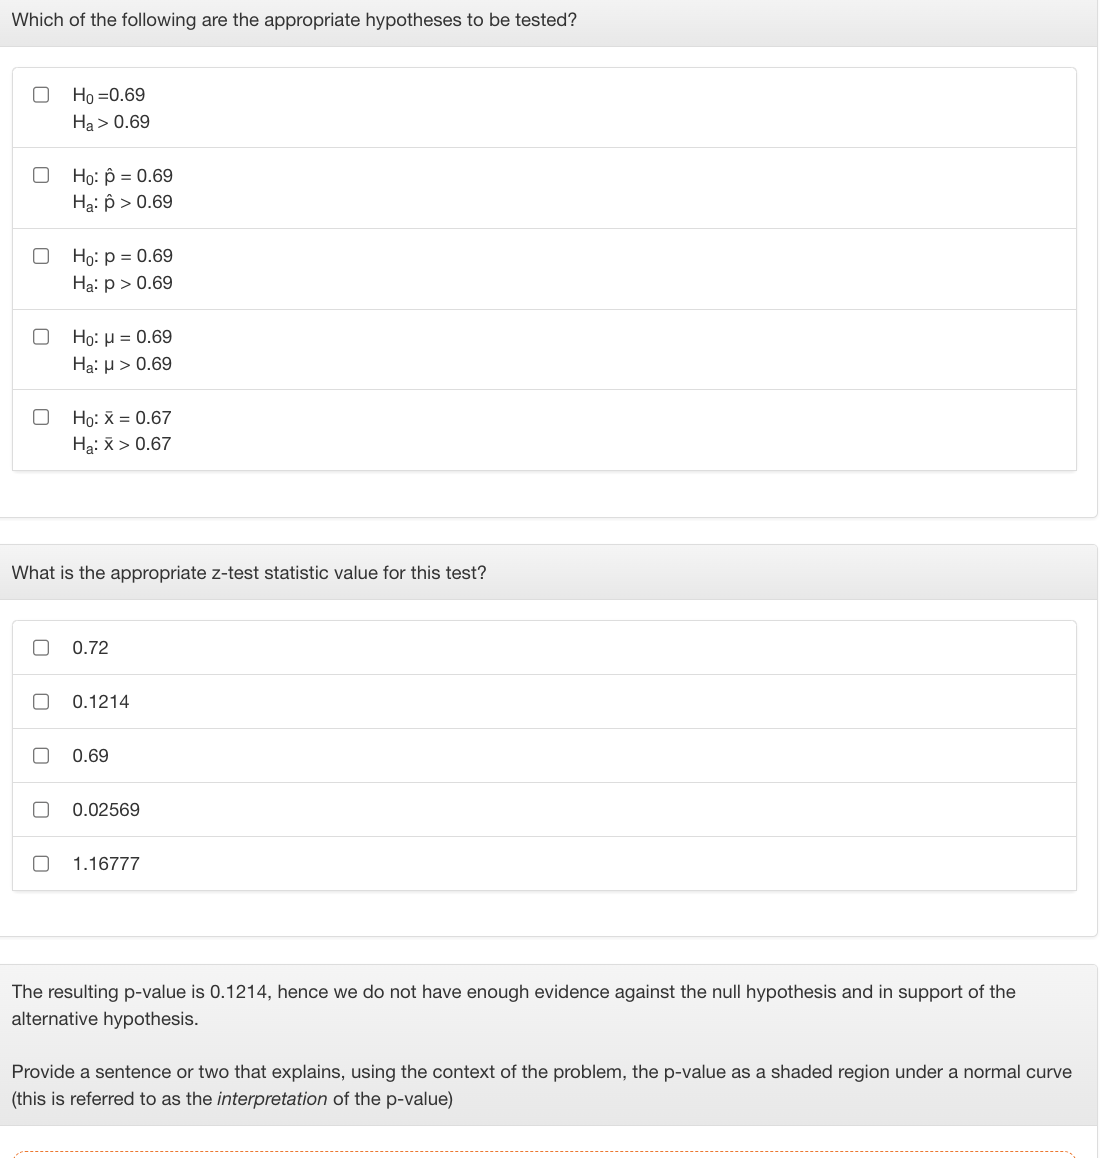
Which of the following are the appropriate hypotheses to be tested? Ho=0.69 Ha> 0.69 0 Ho: p = 0.69 Ha: p > 0.69 Ho: P = 0.69 Ha: p > 0.69 Ho: μ = 0.69 Ha: μ> 0.69 Ho: X = 0.67 H₂: x > 0.67 What is the appropriate z-test statistic value for this test? 0.72 0.1214 0.69 0.02569 1.16777 The resulting p-value is 0.1214, hence we do not have enough evidence against the null hypothesis and in support of the alternative hypothesis. Provide a sentence or two that explains, using the context of the problem, the p-value as a shaded region under a normal curve (this is referred to as the interpretation of the p-value)


According to the American Pet Products Association, prior to the pandemic, 69% of all U.S. households had pets. Many people have speculated that the rate of pet ownership increased during the pandemic. Recently, a group of veterinarians surveyed a random sample of 325 U.S. households and found that 234 had pets.
Given that
Sample size (n)=325
found that 234 had pet
Population proportion (p)=0.69
We have to test hypothesis for the claim that Many people have speculated that the rate of pet ownership increased during the pandemic...

Trending now
This is a popular solution!

Step by step
Solved in 3 steps with 1 images

I am confused - is this the explanation for the last quesiton?
Hence there is strong evidence to that Many people have speculated that the rate of pet ownership increased during the pandemic.


