Which of the following categories has the most precise estimate? Activity (% time) OC OB OA 95- 90 85 80 75 70 T T T 1,::i. ЮН we cannot tell from this figure I Data A B C
Which of the following categories has the most precise estimate? Activity (% time) OC OB OA 95- 90 85 80 75 70 T T T 1,::i. ЮН we cannot tell from this figure I Data A B C

Algebra & Trigonometry with Analytic Geometry
13th Edition
ISBN:9781133382119
Author:Swokowski
Publisher:Swokowski
Chapter5: Inverse, Exponential, And Logarithmic Functions
Section5.6: Exponential And Logarithmic Equations
Problem 69E

Related questions
Question
Need help
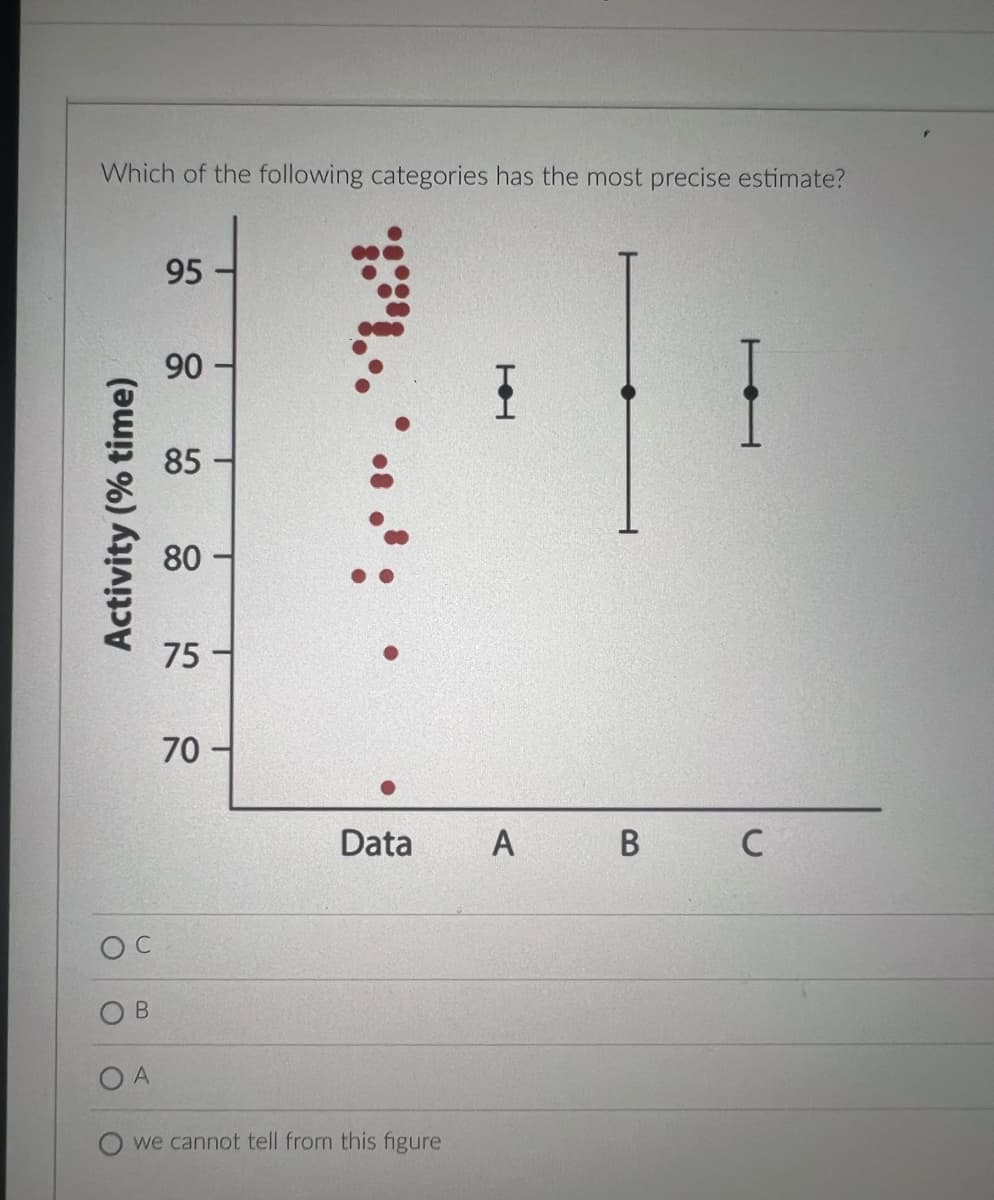
Transcribed Image Text:Which of the following categories has the most precise estimate?
Activity (% time)
OC
B
OA
95
90-
85
T
80-
T
75-
70-
ЮН
Data A
we cannot tell from this figure
B
C
Expert Solution
This question has been solved!
Explore an expertly crafted, step-by-step solution for a thorough understanding of key concepts.

Step by step
Solved in 2 steps

Recommended textbooks for you
Algebra & Trigonometry with Analytic Geometry
Algebra
ISBN:
9781133382119
Author:
Swokowski
Publisher:
Cengage

College Algebra (MindTap Course List)
Algebra
ISBN:
9781305652231
Author:
R. David Gustafson, Jeff Hughes
Publisher:
Cengage Learning

Glencoe Algebra 1, Student Edition, 9780079039897…
Algebra
ISBN:
9780079039897
Author:
Carter
Publisher:
McGraw Hill
Algebra & Trigonometry with Analytic Geometry
Algebra
ISBN:
9781133382119
Author:
Swokowski
Publisher:
Cengage
College Algebra (MindTap Course List)
Algebra
ISBN:
9781305652231
Author:
R. David Gustafson, Jeff Hughes
Publisher:
Cengage Learning
Glencoe Algebra 1, Student Edition, 9780079039897…
Algebra
ISBN:
9780079039897
Author:
Carter
Publisher:
McGraw Hill
