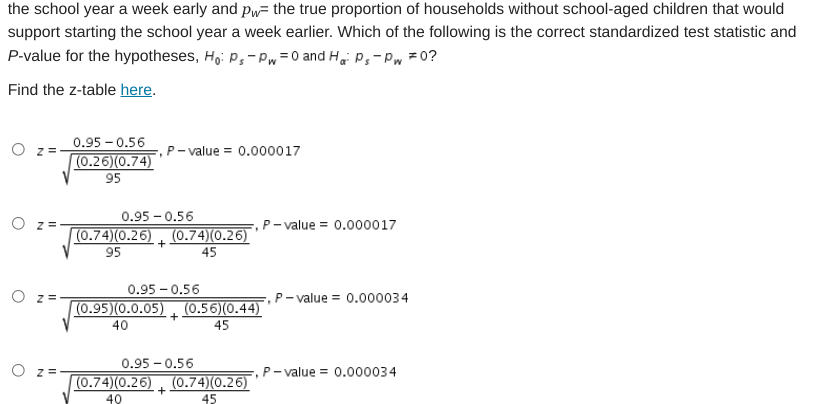
Which of the following is the correct standardized test statistic and P-value for the hypotheses, ?


A local school board believes there is a difference in the proportion of households with school-aged children that would support starting the school year a week earlier, and the proportion of households without school-aged children that would support starting the school year a week earlier. They survey a random sample of 40 households with school-aged children about whether they would support starting the school year a week earlier, and 38 households respond yes. They survey a random sample of 45 households that do not have school-aged children, and 25 respond yes. Let ps= the true proportion of households with school-aged children that would support starting the school year a week early and pw= the true proportion of households without school-aged children that would support starting the school year a week earlier. Which of the following is the correct standardized test statistic and P-value for the hypotheses, ?


Trending now
This is a popular solution!

Step by step
Solved in 2 steps with 2 images


