Which of the following statements regarding this graph are correct (true)? There are more than one statement that is correct. Mark/select all the ones you believe to be correct. The graph indicates the impact on the NPV of variations in each variable separately (Price, quantity, tax shelter, and production costs) Out of all the negative related variables, the most critical is tax shelter The NPV of the project is equal to zero when the production costs are at about 95% of expected levels
Which of the following statements regarding this graph are correct (true)? There are more than one statement that is correct. Mark/select all the ones you believe to be correct. The graph indicates the impact on the NPV of variations in each variable separately (Price, quantity, tax shelter, and production costs) Out of all the negative related variables, the most critical is tax shelter The NPV of the project is equal to zero when the production costs are at about 95% of expected levels

Essentials of Business Analytics (MindTap Course List)
2nd Edition
ISBN:9781305627734
Author:Jeffrey D. Camm, James J. Cochran, Michael J. Fry, Jeffrey W. Ohlmann, David R. Anderson
Publisher:Jeffrey D. Camm, James J. Cochran, Michael J. Fry, Jeffrey W. Ohlmann, David R. Anderson
Chapter8: Time Series Analysis And_forecasting
Section: Chapter Questions
Problem 6P: Consider the following time series data:
Construct a time series plot. What type of pattern exists...

Related questions

Question
7
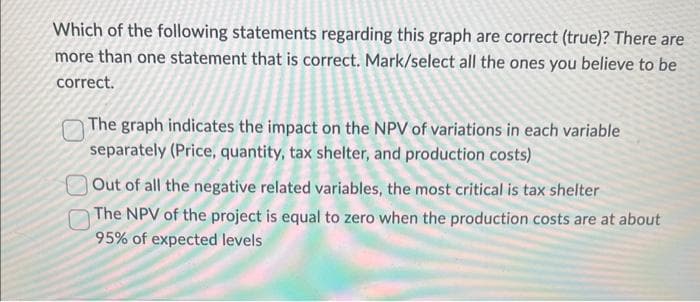
Transcribed Image Text:Which of the following statements regarding this graph are correct (true)? There are
more than one statement that is correct. Mark/select all the ones you believe to be
correct.
The graph indicates the impact on the NPV of variations in each variable
separately (Price, quantity, tax shelter, and production costs)
Out of all the negative related variables, the most critical is tax shelter
The NPV of the project is equal to zero when the production costs are at about
95% of expected levels
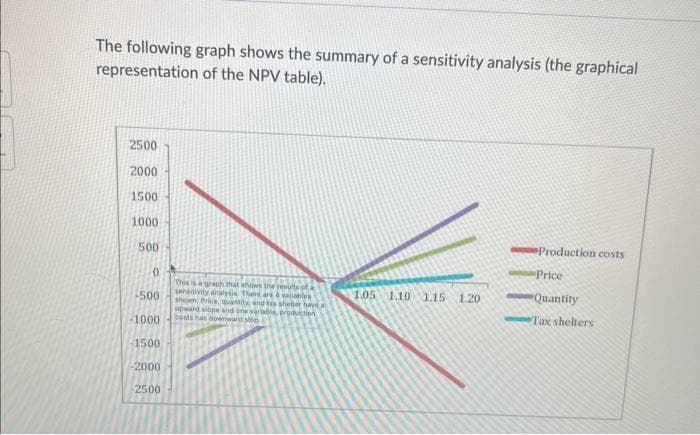
Transcribed Image Text:The following graph shows the summary of a sensitivity analysis (the graphical
representation of the NPV table).
2500
2000
1500
1000
500
0
-500
-1000
-1500
-2000
-2500
This is a graph that shows the results of
sensitivity analysis. There are 4 variables
shown Price, quantity, and tes shelber hav
upward slope and one variable, production
costs has downward sled
1.05 1.10 1.15
1.20
Production costs
Price
"Quantity
Tax shelters
Expert Solution
This question has been solved!
Explore an expertly crafted, step-by-step solution for a thorough understanding of key concepts.

Step by step
Solved in 2 steps

Knowledge Booster


Learn more about
Need a deep-dive on the concept behind this application? Look no further. Learn more about this topic, finance and related others by exploring similar questions and additional content below.Recommended textbooks for you
Essentials of Business Analytics (MindTap Course …
Statistics
ISBN:
9781305627734
Author:
Jeffrey D. Camm, James J. Cochran, Michael J. Fry, Jeffrey W. Ohlmann, David R. Anderson
Publisher:
Cengage Learning

Essentials Of Business Analytics
Statistics
ISBN:
9781285187273
Author:
Camm, Jeff.
Publisher:
Cengage Learning,
Essentials of Business Analytics (MindTap Course …
Statistics
ISBN:
9781305627734
Author:
Jeffrey D. Camm, James J. Cochran, Michael J. Fry, Jeffrey W. Ohlmann, David R. Anderson
Publisher:
Cengage Learning
Essentials Of Business Analytics
Statistics
ISBN:
9781285187273
Author:
Camm, Jeff.
Publisher:
Cengage Learning,