Which predictors of weight loss are statistically significant, if either? What is the predicted weight loss for someone who consumes 2,000 calori hour per day on average? What is the literal interpretation for the slope of hours of aerobic exercise
Which predictors of weight loss are statistically significant, if either? What is the predicted weight loss for someone who consumes 2,000 calori hour per day on average? What is the literal interpretation for the slope of hours of aerobic exercise

Chapter6: Exponential And Logarithmic Functions
Section6.8: Fitting Exponential Models To Data
Problem 1TI: Table 2 shows a recent graduate’s credit card balance each month after graduation. a. Use...

Related questions
Question
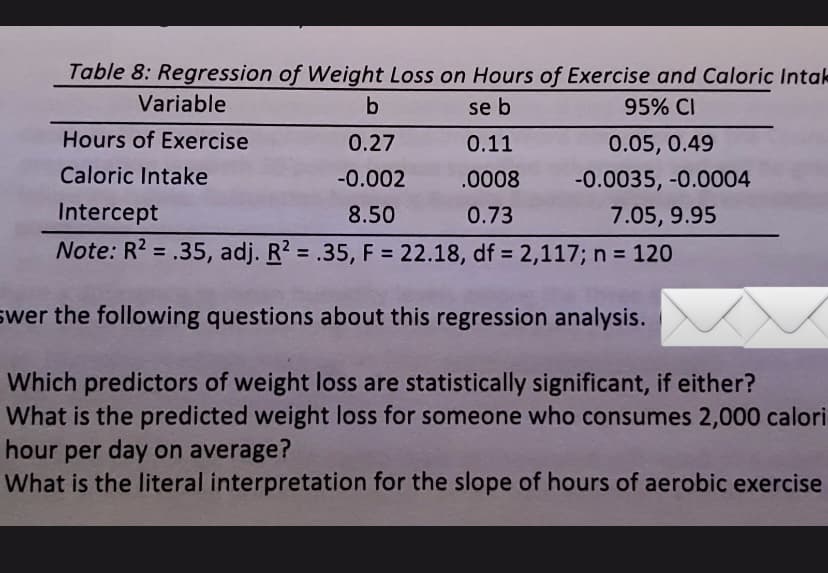
Transcribed Image Text:Table 8: Regression of Weight Loss on Hours of Exercise and Caloric Intalk
Variable
se b
95% CI
Hours of Exercise
0.27
0.11
0.05, 0.49
Caloric Intake
-0.002
.0008
-0.0035, -0.0004
Intercept
8.50
0.73
7.05, 9.95
Note: R? = .35, adj. R? = .35, F = 22.18, df = 2,117; n = 120
%3D
swer the following questions about this regression analysis.
Which predictors of weight loss are statistically significant, if either?
What is the predicted weight loss for someone who consumes 2,000 calori
hour per day on average?
What is the literal interpretation for the slope of hours of aerobic exercise
Expert Solution
This question has been solved!
Explore an expertly crafted, step-by-step solution for a thorough understanding of key concepts.

This is a popular solution!

Trending now
This is a popular solution!

Step by step
Solved in 2 steps with 2 images

Recommended textbooks for you

College Algebra
Algebra
ISBN:
9781305115545
Author:
James Stewart, Lothar Redlin, Saleem Watson
Publisher:
Cengage Learning

Algebra & Trigonometry with Analytic Geometry
Algebra
ISBN:
9781133382119
Author:
Swokowski
Publisher:
Cengage
College Algebra
Algebra
ISBN:
9781305115545
Author:
James Stewart, Lothar Redlin, Saleem Watson
Publisher:
Cengage Learning
Algebra & Trigonometry with Analytic Geometry
Algebra
ISBN:
9781133382119
Author:
Swokowski
Publisher:
Cengage

Functions and Change: A Modeling Approach to Coll…
Algebra
ISBN:
9781337111348
Author:
Bruce Crauder, Benny Evans, Alan Noell
Publisher:
Cengage Learning

Glencoe Algebra 1, Student Edition, 9780079039897…
Algebra
ISBN:
9780079039897
Author:
Carter
Publisher:
McGraw Hill