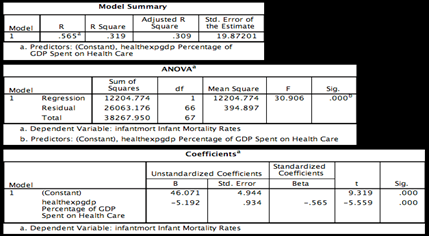
What percentage of the variation in infant mortality rate is explained by this model? Based on the results of the ANOVA table, is this a good model and why or why not? Is the relationship between percentage of GDP spent on healthcare and infant mortality rate statistically significant? What is the direction of the relationship? For each one percent increase in percentage of GDP spent on health care, we would expect the infant mortality rate to ________ (increase or decrease)


Correlation
Correlation defines a relationship between two independent variables. It tells the degree to which variables move in relation to each other. When two sets of data are related to each other, there is a correlation between them.
Linear Correlation
A correlation is used to determine the relationships between numerical and categorical variables. In other words, it is an indicator of how things are connected to one another. The correlation analysis is the study of how variables are related.
Regression Analysis
Regression analysis is a statistical method in which it estimates the relationship between a dependent variable and one or more independent variable. In simple terms dependent variable is called as outcome variable and independent variable is called as predictors. Regression analysis is one of the methods to find the trends in data. The independent variable used in Regression analysis is named Predictor variable. It offers data of an associated dependent variable regarding a particular outcome.
- What percentage of the variation in infant mortality rate is explained by this model?
- Based on the results of the ANOVA table, is this a good model and why or why not?
- Is the relationship between percentage of GDP spent on healthcare and infant mortality rate statistically significant?
- What is the direction of the relationship?
- For each one percent increase in percentage of GDP spent on health care, we would expect the infant mortality rate to ________ (increase or decrease) by _____.


Trending now
This is a popular solution!

Step by step
Solved in 5 steps with 3 images


