Which statement is true about the data shown below (a=0.05) 20 40 60 80 y 24 1.20 1.71 2.22 a. The regression line doesn't pass through the origin b. R2=0.9716 c. There is no linear relationship between y and x O Od. Y= 0.270+ 0.03225 X
Which statement is true about the data shown below (a=0.05) 20 40 60 80 y 24 1.20 1.71 2.22 a. The regression line doesn't pass through the origin b. R2=0.9716 c. There is no linear relationship between y and x O Od. Y= 0.270+ 0.03225 X

Functions and Change: A Modeling Approach to College Algebra (MindTap Course List)
6th Edition
ISBN:9781337111348
Author:Bruce Crauder, Benny Evans, Alan Noell
Publisher:Bruce Crauder, Benny Evans, Alan Noell
Chapter5: A Survey Of Other Common Functions
Section5.6: Higher-degree Polynomials And Rational Functions
Problem 1TU: The following fictitious table shows kryptonite price, in dollar per gram, t years after 2006. t=...

Related questions
Question
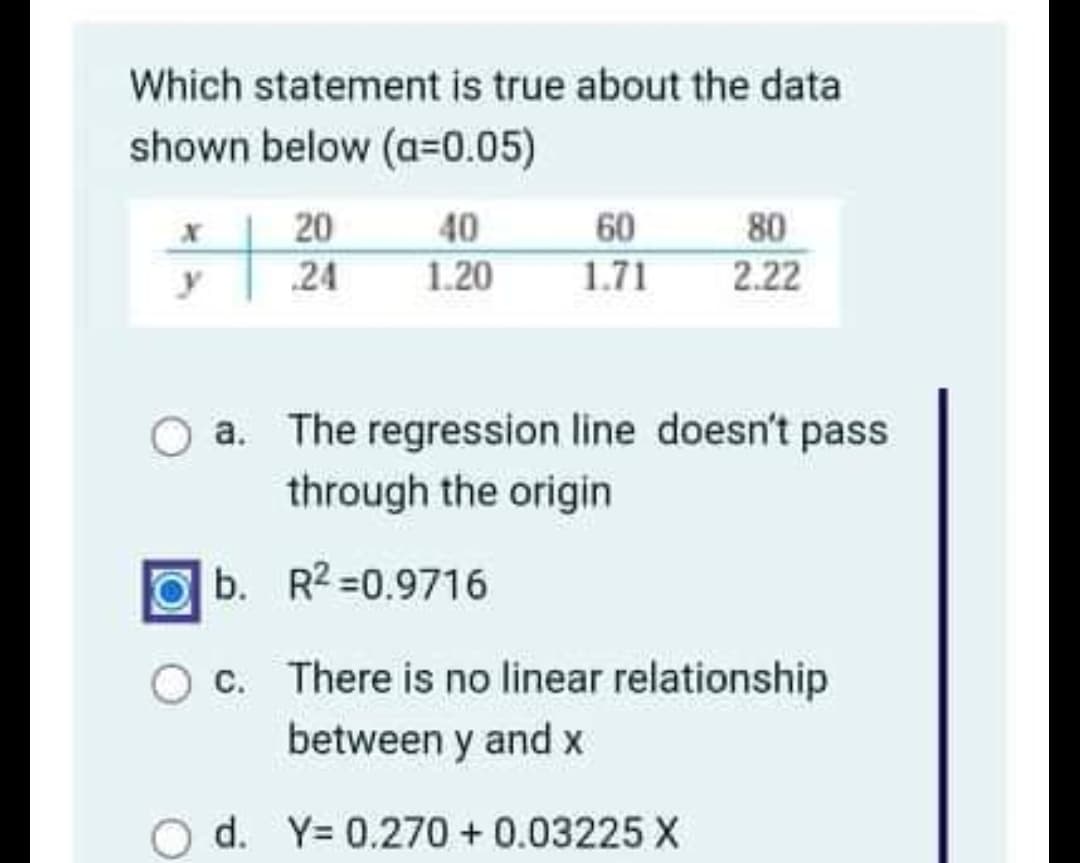
Transcribed Image Text:Which statement is true about the data
shown below (a=0.05)
20
40
60
80
y
24
1.20
1.71 2.22
O a. The regression line doesn't pass
through the origin
b.
R2=0.9716
c.
There is no linear relationship
between y and x
d. Y= 0.270 + 0.03225 X
Expert Solution
This question has been solved!
Explore an expertly crafted, step-by-step solution for a thorough understanding of key concepts.

Step by step
Solved in 4 steps with 3 images

Recommended textbooks for you
Functions and Change: A Modeling Approach to Coll…
Algebra
ISBN:
9781337111348
Author:
Bruce Crauder, Benny Evans, Alan Noell
Publisher:
Cengage Learning

Glencoe Algebra 1, Student Edition, 9780079039897…
Algebra
ISBN:
9780079039897
Author:
Carter
Publisher:
McGraw Hill

College Algebra
Algebra
ISBN:
9781305115545
Author:
James Stewart, Lothar Redlin, Saleem Watson
Publisher:
Cengage Learning
Functions and Change: A Modeling Approach to Coll…
Algebra
ISBN:
9781337111348
Author:
Bruce Crauder, Benny Evans, Alan Noell
Publisher:
Cengage Learning
Glencoe Algebra 1, Student Edition, 9780079039897…
Algebra
ISBN:
9780079039897
Author:
Carter
Publisher:
McGraw Hill
College Algebra
Algebra
ISBN:
9781305115545
Author:
James Stewart, Lothar Redlin, Saleem Watson
Publisher:
Cengage Learning