Which statistical test do you use when you want to compare the change in average of group to the average of another group before and after a treatment?


Q: Give 2 examples of Mode in Measure of central tendency to grouped data
A: 1)The following table represents the number of times that 100 randomly selected students ate at the…
Q: What is the coefficient of determination for the data above?
A: Step-by-step procedure to find the regression line using Excel: In Excel sheet, enter x and y in…
Q: What statistical test would you use to compare three different groups on some dependent variable?
A: Given : What statistical test would you use to compare three different groups on some dependent…
Q: When data are collected in a statistical study for only a portion or subset of all elements of…
A: A sample is a part of the population, which is selected from the population and if the sample is…
Q: What is an important difference between correlation and causation? Which is harder to establish, and…
A: We have to tell about the difference between correlation and the causation. Correlation :…
Q: The table and the bar chart below summarize the age at diagnosis, in years, for a random sample of…
A: State the hypotheses.
Q: The average student studies eight hours for a statistics exam and receives a grade of µ = 84. In a…
A: The random variable studying twelve hours follows normal distribution. We have to find the critical…
Q: Why we need different measures of central tendency and dispersion, if mean is given? Briefly explain…
A: The different measures of central tendency are as follows: 1. Mean: It is the most popularly used…
Q: How to interpret the result according to the above data?
A: Decision Rule: Reject H0 if p value less than or equal to α. Let us consider, α=0.05. From the given…
Q: Which correlation is most likely a causation? the positive correlation between the wait time for the…
A: Two quantities or characteristics may appear to be correlated but correlation does not always imply…
Q: You wanted to see if there are differences in the sleeping patterns between males and females when…
A: An observational study is a method in which you simply observe the responder without providing them…
Q: give one disadvantage of using experience sampling and one advantage of using correlational methods…
A: Disadvantage of using experience sampling Despite the strengths and promise of this method, there…
Q: as sample size gets smaller, what happens to the magnitude of the correlation necessary for…
A: Correlation : Correlation describes the relationship between two quantitative variables .…
Q: (a) Show that 2X is also an unbiased estimator of B. the properties of sample mean,
A: Given: Random variable x with mean (beta/2) Then to show that "2*xbar" be the unbiased estimate…
Q: Q2) choose correct answer: 1- statistics about marriages, divorces and death is called vital bio…
A: Identify True or False
Q: What is the role of displays in statistics?
A: There are mainly two types of displays in statistics, such as, graphical representation and table or…
Q: Q2) choose correct answer: 1- statistics about marriages, divorces and death is called vital bio…
A: We have given that the statement about to the vital biostatistics which contain the data about…
Q: c of a population
A: The sampling variability is a type of variability attributed to sampling.
Q: You collect data on number of hours spent studying, on average, throughout the Fall 2020 semester…
A: Statement: The Statistical test used to compare the students at Stonehill and Holy Cross to look…
Q: Can we say that there is a significant positive correlation among the data? (a = .05)
A: Since you have asked multiple questions, we will solve the first question for you. If you want any…
Q: Scenrio :Data from the Motor Vehicle Department indicate that 80% of all licensed drivers are older…
A:
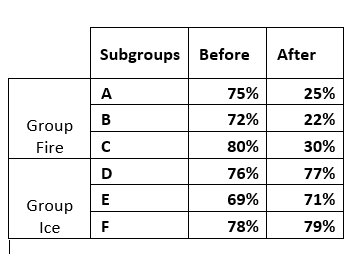
Q: Using the table, How would you write the results for the statistically significant improvements in…
A: Here, we have a data related to 30 individuals. Studying caregiver's stigma, a few questions have…
Q: Before beginning a new and costly advertising campaign, Starbucks would like to know how best to…
A: Given information: Given data represents the observed counts of two categories gender and coffee…
Q: Consider the following scenario: you want to investigate the relationship between the number of…
A: Here we want to see if there is a relationship between 'likes' on Facebook and 'number of friends'…
Q: In a case-control study, you can ndardize the case group's age distribution that of the control…
A: The case–control is a type of epidemiological observational study. An observational study is a study…
Q: How do you calculate the p-value given the correlation coefficiet (R) and the sample (n)?
A: We have to calculate p value if correlation coefficient (R) and sample size (n) is given We can…
Q: Male and female athletes exercised for an hour on a treadmill. During this time, half of each sex…
A: To use: What statistical test should be used to see how sex and type of beverage affect lactic acid…
Q: A researcher wants to determine whether there is an association between weight and scores on the…
A: Given: R-value = 0.213 P-value = 0.3
Q: Describe when you would use an analysis of variance versus an independent samples t-test.
A: Analysis of variance (ANOVA) is used when we have more than two independent samples whereas…
Q: 6. Investigate the association between eye colour of husbands and eye colour of wives from the data…
A: Given, Wives with light eyes Wives with no light eyes Total Husbands with light eyes 309 214…
Q: What is the value of the correlation coefficient r across the entire data set (all 10 students)?
A: INTRODUCTION : CORRELATION: In a bivariate distribution, we may be interested to find out if…
Q: 1. does correlation imply causation? 2. Why are correlation important to statistics?
A:
Q: re interested in examining the variability in current marital status by race. Which measure of…
A: Nominal variables are used with categorical data because they do not have quantitative values. In…
Q: ) what is the first quartile? B) % of the data between 30 and 36
A: See the handwritten solution
Q: What is Comparison between two groups?
A: Disclaimer, Since you have asked multiple question, we will solve the first question for you. If you…
Q: Is there a linear association between age and days? Explain using the sample illustration below.
A: Scatter plot is a graph that shows the direction as well as linearity of the relationship between…
Q: What is Variability within Groups?
A: The term variability within groups is used in ANOVA technique, it is also known as error variance…
Q: A scientist wants to examine factors that may be related to cancer. The scientist believes that…
A: Two-factor ANOVA is an appropriate test to be used here.
Q: Explain if there was a statistically significant difference between the group means. did you arrive…
A: Test is that whether there was a difference between the three means. Level of significance = 0.01
Q: What is the relationship of population, sampling, sample, and inference in statistics?
A: Statistics is a field of study which involves collecting, arranging, analyzing, and drawing…
Q: What is an example of a statistical presentation ? What is it telling you ?What areas can the…
A: Statistical presentation is the way of organizing data into tables, graphs or charts.It is useful to…
Q: You are a public health researcher. You want to see if the average age that a person starts smoking…
A: We have to find that which statistical test would be best to determine if there is a significant…
Q: Does this describe an observational study or an experiment? The haircolor of shoppers at the mall…
A: Solution: The hair color of shoppers at the mall were recorded is an observational study .…
Q: Is there a statistically significant difference between classical and dance groups'in this data set?…
A: Given: the significant difference between classical and dance groups in this data set
Q: A researcher wants to know if taking statistics improves critical thinking skills. She randomly…
A: Given that, A researcher wants to know if taking statistics improves critical thinking skills. She…
Q: Which one of the cumulative frequencies can be taken while calculating median of the grouped data?…
A: We have to choose correct option .
Q: Explain the relation between a population and a sample. What characteristics should a sample have to…
A: A sample is basically a subset of population that is used in the research. For example if your…
Q: A researcher is looking at the relationship between rates of lung cancer and smoking status. they…
A: There are two variables in the study; *Smoking status of subjects, in terms of yes or no. *Lung…
Q: differentiate the following statistical terminologies with some examples. Descriptive Statistics and…
A: Let DS denote Descriptive Statistics. Let IS denote Inferential Statistics.
Which statistical test do you use when you want to compare the change in average of group to the average of another group before and after a treatment?

Step by step
Solved in 2 steps


- Use the table below and assume a population of 317 million. How much greater is the risk of death from Alzheimer's disease than the risk of death from diabetes? Leading causes of death in a certain country in a recent year Cause Deaths Cause Deaths Heart disease 596,600 Alzheimer's disease 84,700 Cancer 575,300 Diabetes 73,100 Chronic respiratory diseases 143,200 Pneumonia/Influenza 53,500 Stroke 128,700 Kidney disease 45,400 Accidents 122,300 Suicide 38,900 The risk of death from Alzheimer's disease is about how many times greater than risk of death from diabetesThe following chart shows student population in a certain elementary school over a 5 year period.At a high school reunion, a the 20 students in graduating from the class of 2001 got into a chat about their annual incomes. Here is the list that they formed. 61532 70568 84127 66569 38013 67252 71947 83710 247894 66328 77208 1386592 74472 136568 73424 62791 76862 66412 42777 66445 What will be the right parameter to describe the achievement of this particular class, with regards to the money they all make?
- Weight City MPG 3968 20 3583 22 3470 22 3527 23 3990 18 4724 17 3692 21 3315 22 3616 20 5527 14 3719 16 3097 26 3800 19 3532 25 2269 31 5674 15 3402 20 4029 19 3996 19 3242 23 2434 31 2575 29 2960 27 3618 15 4054 19 3192 24 3305 23 3605 19 4240 15 3933 18 3633 19 3790 17 3477 20 3258 21 4685 17 2776 25 2615 24 3186 21 5137 13 3461 21 4233 16 4178 18 4702 17 3713 22 5794 14 2306 28 3194 26 3428 22 4894 12 4751 17 2605 29 3296 25 5267 13 2789 25 3570 19 4011 18 2363 27 4398 15 2806 25 2127 36 2665 27 3419 24 3427 24 3280 25 5765 13 3465 24 2295 30 3038 22 3070 25 4711 17 3230 24 3528 21 4667 16 SUMMARY OUTPUT Regression Statistics Multiple R 0.894328844 R Square 0.799824082 Adjusted R Square 0.797004703 Standard Error 2.238112689…Ashton surveyed the students in his neighborhood and obtained the following contingency table that summarizes the school enrollment by level and type:Value Added by Mfg. 23518 15724 24506 21667 20712 12640 4258 35210 20548 23442 287 1508 624 2471 4307 673 817 8986 3145 4076 3806 4276 1239 9423 11045 1916 599 2063 34 1445 10603 5775 10404 13274 1909 4606 5518 12464 5447 2290 4182 2818 2201 18848 9655 15668 25918 30692 17982 17857 9699 38407 3878 3989 4388 4055 16567 25025 59813 31801 8497 28886 12277 11547 26006 3464 2187 7079 442 4528 7275 55621 1313 162 1907 53 747 328 233 1717 6532 4850 3509 2176 2696 15739 999 7838 29180 9061 4200 1410 16670 5856 3164 3999 11750 4412 27974 6936 19880 7793 3528 21718 10513 9545 18178 22673 19221 23110 41135 17521 25322 6700 14278 9466 13428 3459 38705 84059 13920 105899 45220 7903 2590 1435 9986 3564 21071 29028 31051 2390 14032 415 2761 685 8327 2643 1406 11199 Cost of Materials 78713 42774 27222 37040 12030 13674 19130 33521 19612 5557 163 314 2622 4219 5357 1061 707 10421 4140 7125 8994 5504 716 8926 11121 2283 364 1813 71 1321 12376 9661 19285 18632 2170 7290 8135 12980 4011 5101 3755 2694…
- The table below gives adult wine consumption.How would you conduct a sample of people in your community so that you could see which flavors are most popular? Give specific details of how you would collect your data, and state how many responses would be sufficient.The following data were taken from the annual reports of Big Bang Inc., a manufacturer of fireworks, and Orange Inc., a manufacturer of computers. Big Bang, Inc. Orange, Inc. Cost of goods sold $830,000 $11,540,000 Inventory, end of year 190,000 320,000 Inventory, beginning of year 240,000 290,000 What is the inventory turnover for Big Bang and Orange. a. Big Bang, Inc.: 3.86Orange, Inc.: 37.84 b. Big Bang, Inc.: 3.86Orange, Inc.: 9.65 c. Big Bang, Inc.: 94.55Orange, Inc.: 37.84 d. Big Bang, Inc.: 94.55Orange, Inc.: 9.65